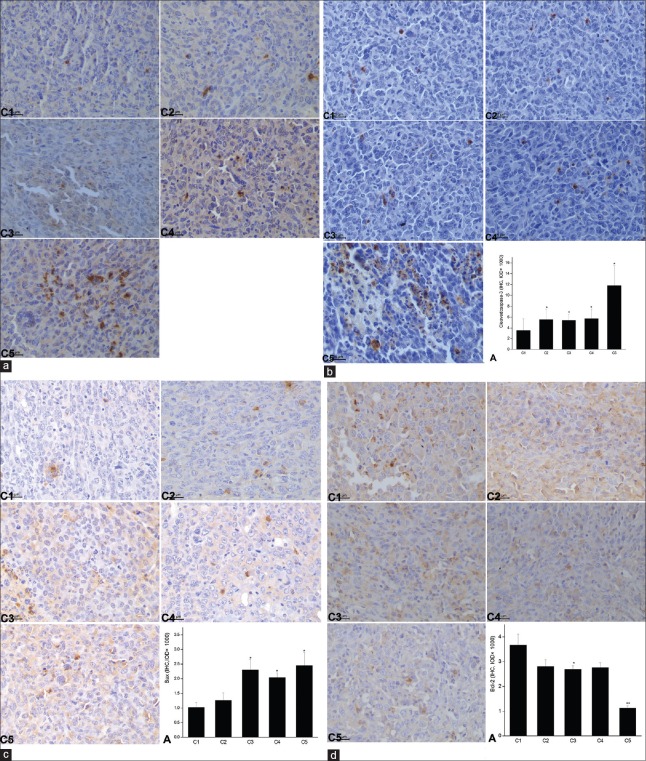
Figure 5.
Immunohistochemistry analysis of the protein expressions (p53, cleaved-Caspase-3, Bax, and Bcl-2) affected by multiple pulses of microwave treatment. (a) p53, (b) cleaved-Caspase-3, (c) Bax, and (d) Bcl-2. Data were presented as mean ± standard deviation (n = 5). *P < 0.05, **P < 0.01 versus the untreated control. Positive immunoreactivity was characterized by brown staining. C1: the untreated control, C2: 10 mW/cm2 × 5 min each day, C3: 10 mW/cm2 × 15 min each day, C4: 30 mW/cm2 × 5 min each day, C5: 30 mW/cm2 × 15 min each day. All the groups were microwave-treated for continuous 7 days; A: The bar graph showed the IOD values for the positive-staining in the mice lungs of each group as indicated.

