Figure 2.
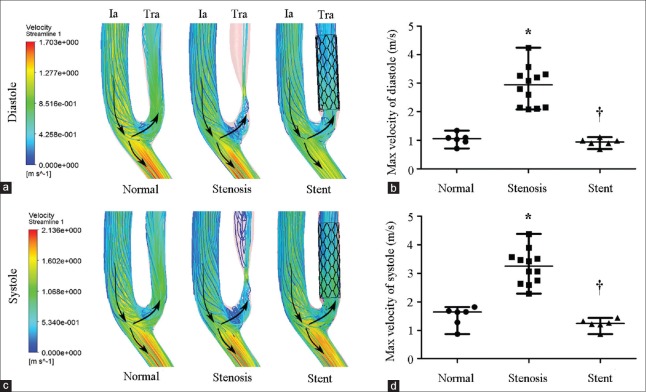
Velocity of normal, stenotic, and stented transplant renal artery. (a) Contours of velocity streamline at end diastole. (b) Maximal velocity of normal (n = 6), stenotic (n = 12), and stented (n = 6) transplant renal artery at end diastole. (c) Contours of velocity streamline at peak systole. (d) Maximal velocity of normal (n = 6), stenotic (n = 12), and stented (n = 6) transplant renal artery at peak systole. Ia: Iliac artery; Tra: Transplant renal artery; Arrows: The direction of blood flow. Results are the median. *P < 0.05 versus normal; †P < 0.05 versus stenosis.

