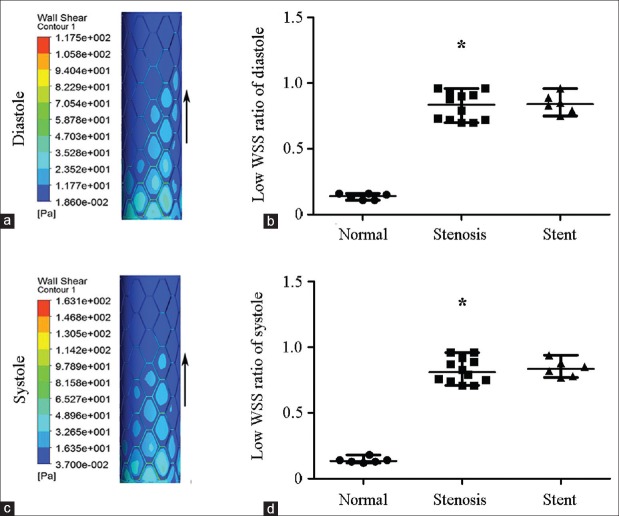
Figure 4.
WSS distribution of the stented segment of transplant renal artery and low WSS ratio (area low WSS/area total) of normal, stenotic, and stented transplant renal artery. A large area of low WSS (dark blue zone) was clearly visible around the stent struts and high WSS (red zone) was just at the stent struts. (a) WSS distribution at end diastole. (b) Low WSS ratio (area low WSS/area total) at end diastole. (c) WSS distribution at peak systole. (d) Low WSS ratio at peak systole. WSS: Wall shear stress; Arrows: The direction of blood flow. Results are the median. *P < 0.05 versus normal.

