
Figure 3.
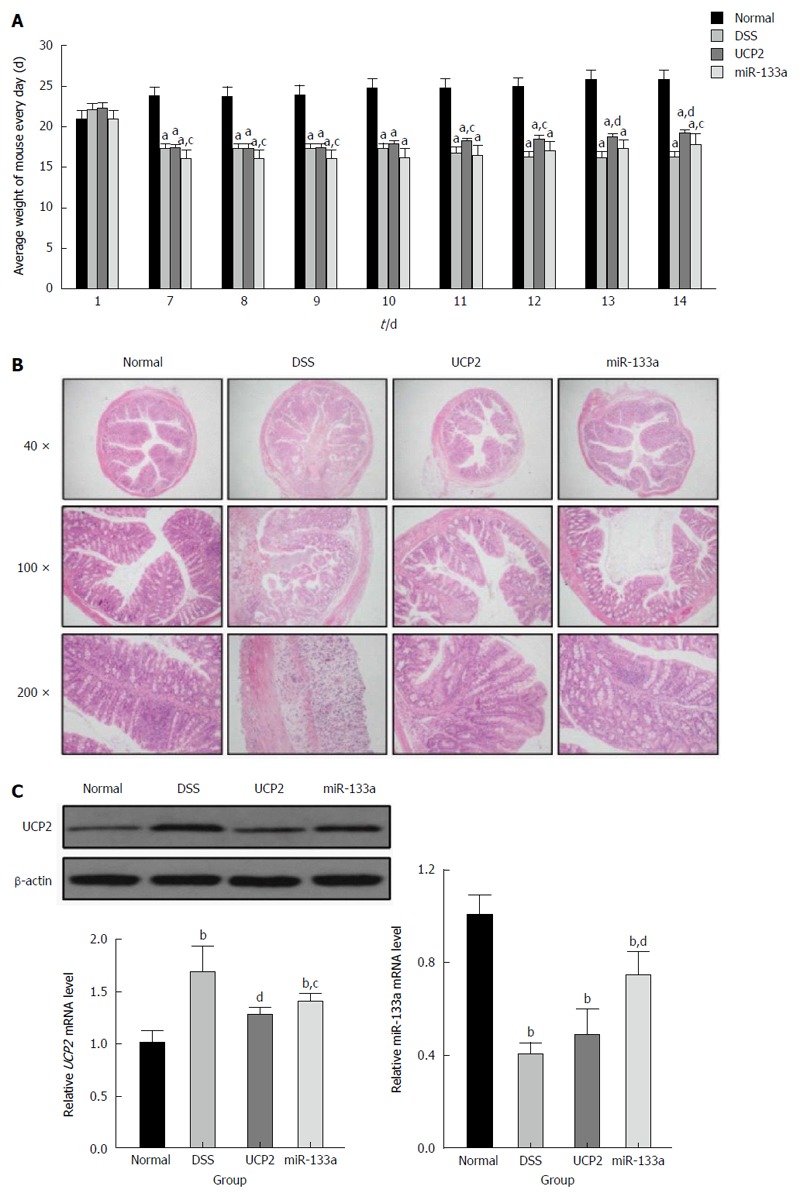
Inflammatory bowel disease phenotype change after the successful alteration of the UCP2 and miR-133a levels. A: Changes in the weight of mice in the control, dextran sulfate sodium (DSS), UCP2 and miR-133a groups between days 7 and 14; B: Alleviation of IBD after the alteration of the UCP2 and miR-133a levels, as demonstrated by HE staining; C: Successful UCP2 down regulation and miR-133a up regulation in the UCP2 and miR-133a groups, as shown by Western blot and qRT-PCR, respectively. aP < 0.05, bP < 0.01 vs control; cP < 0.05, dP < 0.01 vs DSS.