
Figure 5.
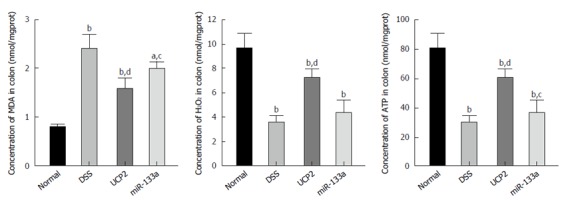
Changes in oxidative stress- and energy-related markers in the dextran sulfate sodium, UCP2 and miR-133a groups. The levels of MDA (left panel), H2O2 (middle panel) and ATP (right panel) were tested by a colorimetric method. aP < 0.05, bP < 0.01 vs control; cP < 0.05, dP < 0.01 vs DSS. DSS: Dextran sulfate sodium.