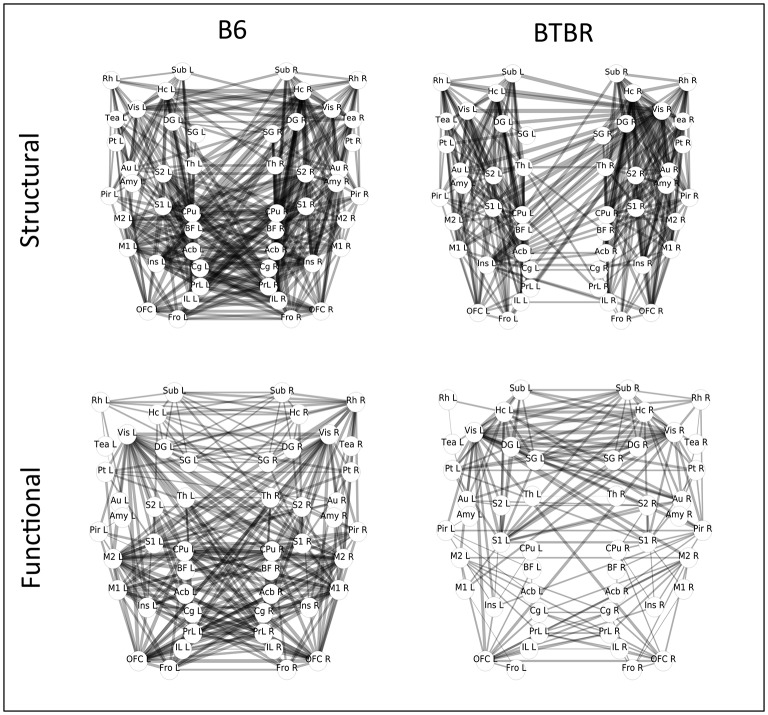
Figure 2.
Graph representation of group-level structural and functional connectivity in the BTBR mouse line, and in the control B6 line. The labels indicate the brain regions corresponding to the nodes of the network, and the weights of the connecting lines indicate the strength of the pairwise connections. The graph represents a top view of the mouse brain, with the anterior part of the brain pointing down, and the two hemispheres on the left and right side, respectively.

