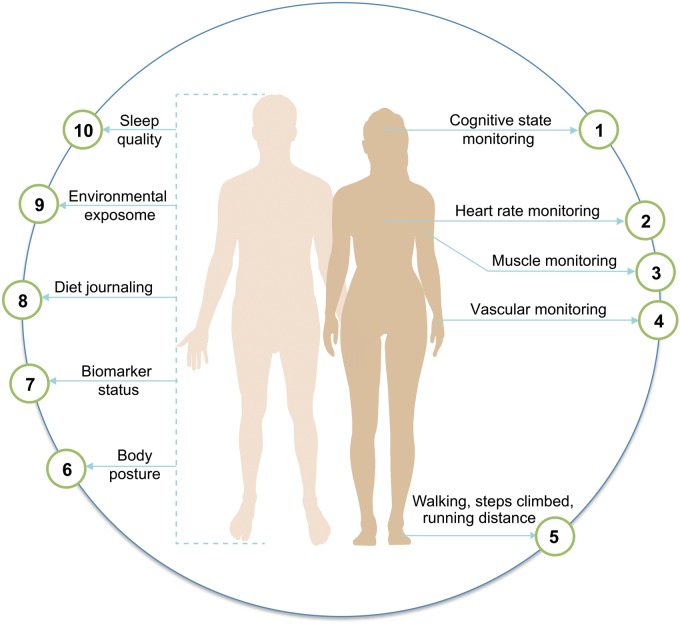
Figure 2.
From health monitoring to predictive modeling of diseases: edges are different health monitoring data streams; nodes indicates disease areas where the health monitoring data can be used for prognostic, diagnostic, clinical, therapeutic or wellness interventions. 1: psychiatric and neurological disease, cerebrovascular disease, stress responses/autonomic reactivity, chronic pain; 2: cardiac arrest, myocardial infarction, coronary heart disease, anxiety, aerobic fitness levels; 3: chronic back pain, movement disorders (Parkinsonism), tremors, rehabilitation recovery, agility testing, dystonia, myalgia, chronic fatigue syndrome; 4: hypertension, orthostatic hypotension, chronic kidney disease, peripheral arterial disease, vasculitis (e.g. Lupus, Raynaud’s disease); 5: movement disorders, rehabilitation, epilepsy, myalgia; 6: chronic and acute lung diseases, obstructive sleep apnea, sleep disorders, narcolepsy, synucleopathies; 7: insulin level (Type 1 or Type 2 diabetes); 8: diabetes, cardiovascular disease, inflammatory bowel disease, irritable bowel syndrome, gluten sensitivity, eating disorders; 9: chronic and acute lung diseases; 10: hyper/hypothyroidism, female endocrinology, obstructive sleep apnea, narcolepsy, neurologic, psychiatric, chronic fatigue syndrome and developmental disease.

