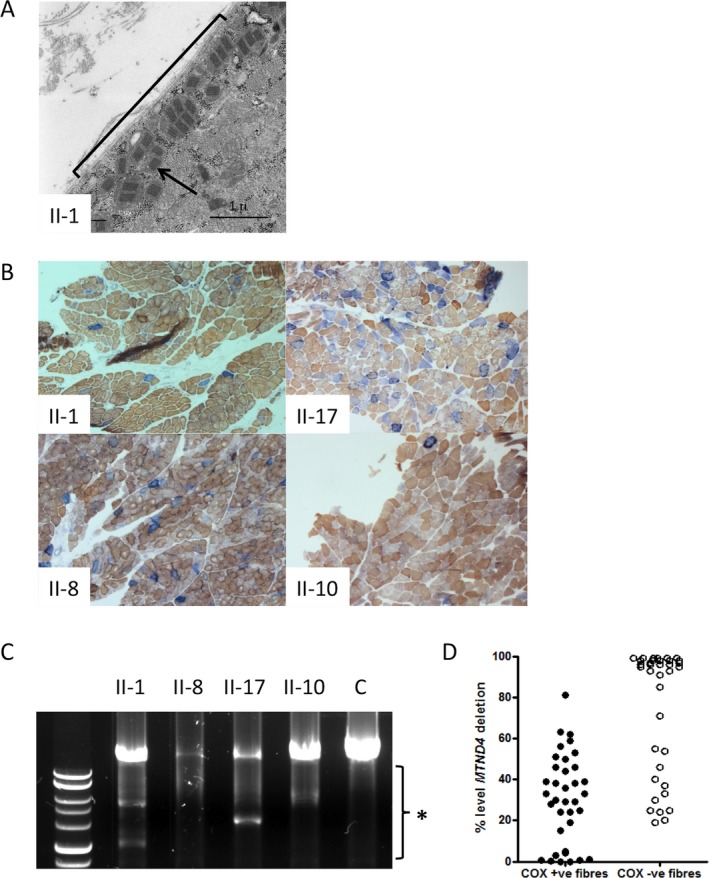
Figure 2.

Electron microscopy, histochemistry, and mtDNA analyses in patient muscle show signs of mitochondrial dysfunction. (A) Electron microscopy of Patient II‐1 skeletal muscle reveals subsarcolemmal accumulation of abnormal mitochondria with paracrystalline inclusions. The general region of subsarcolemnal accumulation is indicated with a black bracket and a black arrow points to one of the paracrystalline inclusions. (B) Sequential COX succinate dehydrogenase (SDH) histochemistry demonstrates a mosaic distribution of COX‐deficient muscle fibers (blue) among fibers exhibiting normal COX activity (brown). Illustrated are the images for Patients II‐1, II‐17, II‐8, and II‐10. (C) Long‐range PCR across the major mtDNA shows evidence of variable mtDNA deletions in muscle from patients II‐1, II‐17, II‐8, and II‐10. The black bracket indicates the region of the gel where deletion fragments segregate. (D) Quantitative, single‐fiber real‐time PCR reveals the majority—but not all—of COX‐deficient fibers contain high levels of a clonally expanded mtDNA deletion involving the MTND4 gene (36 COX‐positive and 36 COX‐deficient fibers laser captured from the biopsy material of patients II‐1, II‐8, and II‐17).
