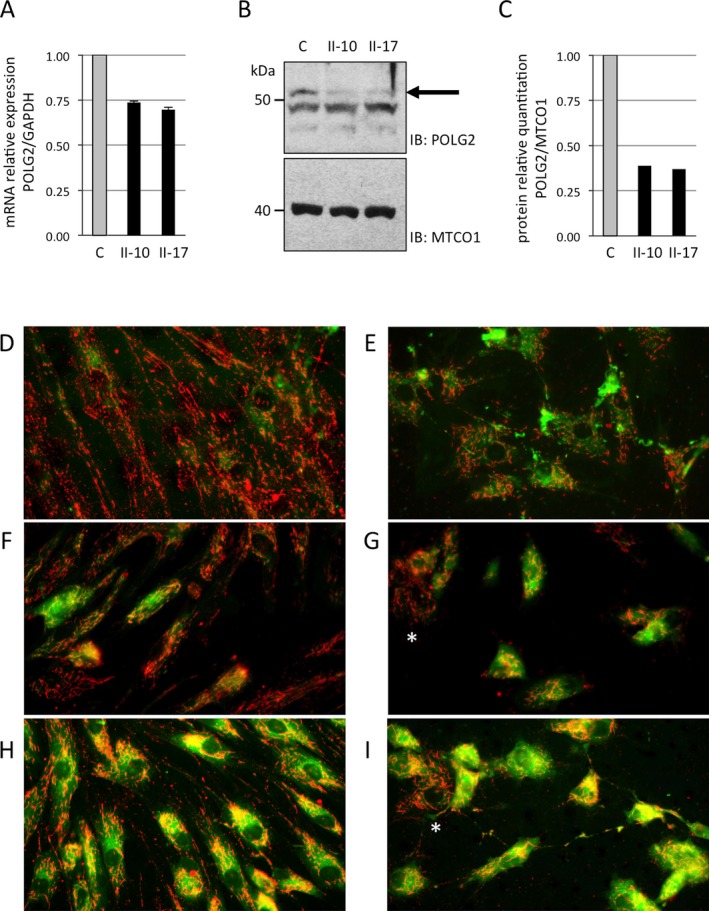
Figure 3.

POLG2 mRNA and protein levels and mitochondrial membrane potential are decreased in patient fibroblasts. The level of POLG2 RNA and protein was measured in control (C) and patient cells (II‐10 and II‐17). (A) Quantitative real‐time PCR experiments were performed for human GAPDH and POLG2 and expressed as a relative quantitation of POLG2/GAPDH. (B) Mitochondrial lysates were analyzed by Western blotting using a rabbit polyclonal antisera raised against the recombinant human POLG2 protein. POLG2 is represented by the top band visible migrating at 55 kilodaltons (kDa), while two additional lower bands represent nonspecific binding. The black arrow points to the POLG2 band to help distinguish it from the nonspecific bands. (C) Relative quantitation of protein was measured by comparing the intensity of POLG2 and MTCO1 bands in controls and patients. D‐I. JC‐1 fluorescence studies of patient fibroblasts show reduced mitochondrial membrane potential. Imaging visualized mitochondria with inactive (green) or active (red) membrane potential. Membrane potential was assessed in untreated (D, F, H) and rotenone‐treated (E, G, I) fibroblast cells. Control fibroblasts are shown in D, E; Patient II‐1 fibroblast in F, G; Patient II‐17 fibroblast in H, I. A mosaic staining pattern of individual cells is present in patient fibroblasts, with some cells displaying predominantly red staining indicative of active mitochondria in these cells (these cells are marked with a white asterisk).
