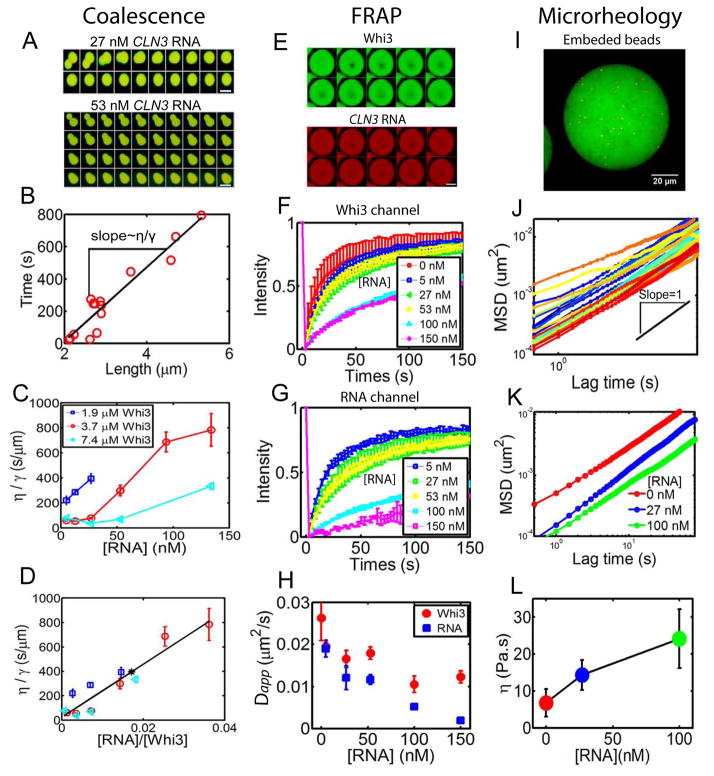
Figure 4. CLN3 RNA influence Whi3 droplet physical properties.
(A) Montages show a fast fusion event with low RNA concentration (27 nM) and a slow fusion event with high RNA concentration (53 nM) for 3.7 μM Whi3 at 150 mM salt. Time interval between images is 50 seconds and scale bar is 5 μm. (B) An example plotting characteristic fusion length when two droplets initially meet against the fusion relaxation time (circles) yields a linear relation, with the slope scales with the ratio of viscosity over surface tension η/γ. (C) Viscosity over surface tension ratio (η/γ) obtained from fusion events plotted against RNA concentration for various Whi3 concentrations. Mean±SEM (D) η/γ scales roughly with RNA to Whi3 molar ratio. Mean±SEM. Black line is a linear fit. Black asterisk on line corresponds to the ratio that gives the largest apparent droplet volume from Fig. S3 that’s based on Fig. 2D. (E) FRAP images show recovery of CLN3 RNA and Whi3. Scale bar is 5 μm. Time interval is 20 seconds. (F) Normalized FRAP curves in Whi3 channel show slower recovery as RNA concentration increases in droplets with 25 μM Whi3 at 60mM salt. Mean±STD. (G) Normalized FRAP curves in RNA channel also show slower recovery as RNA concentration increases. Mean±STD. (H) Decrease in apparent diffusion coefficients with increasing RNA concentration estimated from FRAP data. Mean±STD. (I) An example of fluorescent tracer beads (red) embedded in Whi3 droplets (green). RNA not labeled. (J) An example of MSD for tracer beads in droplets. Black line shows slope=1. (K) Mean MSD with varying RNA concentration in droplets with 25 μM Whi3 at 60mM salt. (L) Viscosity calculated from MSD data. Mean±STD. See also Fig S4.

