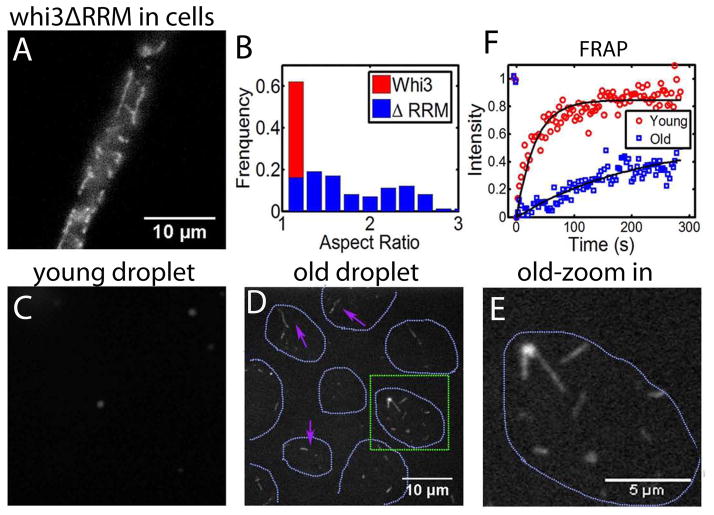
Figure 6. Maturation of droplets over time.
(A) Whi3 structure after deleting RNA binding domain (Whi3ΔRRM) in Ashbya cells. (B) Aspect ratio of Whi3ΔRRM in comparison with wide type Whi3 in Ashbya cells. (C) Adding high salt (2M) to young droplets (1h) disrupted droplets. Salt concentration increased from 150 mM to 300 mM. Droplets were formed with 8 μM full length Whi3 and 200 nM RNA. (D) Adding high salt (2M) to old droplets (≥7h) disrupted droplets but fibers were left. Magenta arrows point at fibers. Green square highlights the region that is zoomed in and shown in (E). Cyan dotted line indicates where droplets were before adding salt. Droplets were formed with 8 μM full length Whi3 and 200 nM RNA. (F) FRAP shows slower Whi3 recovery in old droplets than in young droplets. See also Fig S5.

