FIGURE 5:
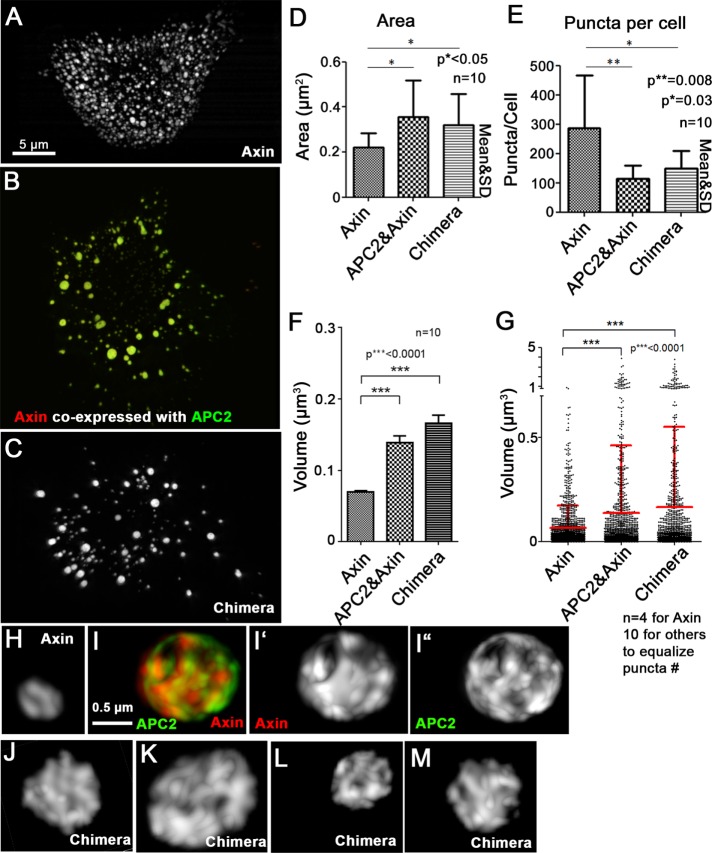
The Chimera mimics the APC2:Axin complex in internal structure and size. (A–C) SIM images. SW480 cells transfected with Axin-RFP (A), GFP-APC2 plus Axin-RFP (B), or GFP-Chimera (C). (D) The cross-sectional area of the chimeric complexes is similar to those produced by APC2 plus Axin and larger than those produced by Axin alone. (E) The number of puncta in Chimera-transfected cells is similar to that in APC2 + Axin–transfected cells and reduced relative to cells expressing Axin alone. Area and number obtained using LSM 710 images and the ImageJ Particle Analyzer. Ten cells quantified per construct. (F, G) Chimera puncta are similar in volume to APC2:Axin complexes and larger than those produced by Axin alone. Puncta volume assessed from SIM images of indicated constructs using Imaris Software (Bitplane). (F) Average puncta volume of indicated constructs. Ten cells used for each condition. (G) Volume comparison of equal numbers of puncta from Axin-transfected (n = 4 cells quantified), APC2 + Axin–transfected (n = 10 cells), or Chimera-transfected (n = 10 cells) cells. Fewer Axin cells were analyzed to equalize puncta number. Student’s t test was used. (H–M) SIM close-up three-dimensional projections of puncta from cells like those in A–C. (H, I) APC2 coexpression (I) leads to a more internal complex structure of Axin puncta than that of puncta assembled from Axin alone (H). (J–M) The Chimera has a complex internal structure resembling that of APC:Axin complexes. Representative images of GFP-Chimera expressed in two different SW480 cells.

