Figure 3.
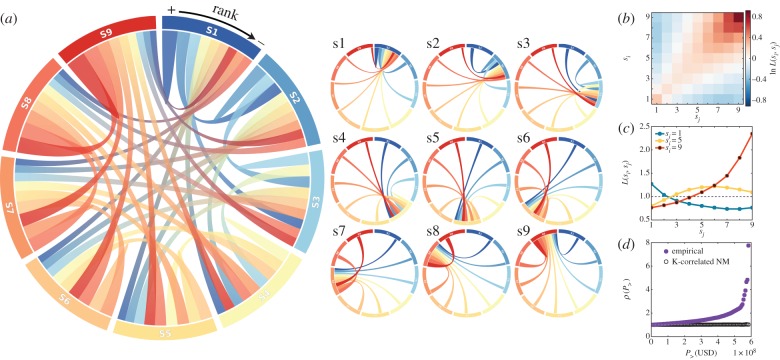
Structural correlations in the socioeconomic network. (a) Chord diagram of connectedness of socioeconomic classes si, where each segment represents a social class si connected by chords with width proportional to the corresponding inter-class link fraction  , and using gradient colours matched with opposite ends sj. Note that the
  normalized fraction of L(si, sj)
 (in equation (2.4)) was introduced here to assign equal segments for each class for better visualization. Chords for each class are sorted in decreasing width order in the direction shown above the main panel. On the minor chord diagrams of panel (a), graphs corresponding to each class are shown with non-gradient link colours matching the opposite end other than the selected class. (b) Matrix representation of L(si, sj) (for definition see equation (2.4)) with logarithmic colour scale. (c) The L(si, sj) function extracted for three selected classes (1 (blue), 5 (yellow) and 9 (red)). Panels (a–d) provide quantitative evidence on the stratified structure of the social network and the upward-biased connections of middle classes. (d) ‘Rich-club’ coefficient ρ(P>) (definition see equation (2.6)) based on the empirical (purple), and a degree-correlated null model (black) networks. On the individual level, the richest people of the population appear to be eight times more densely connected than expected randomly.

