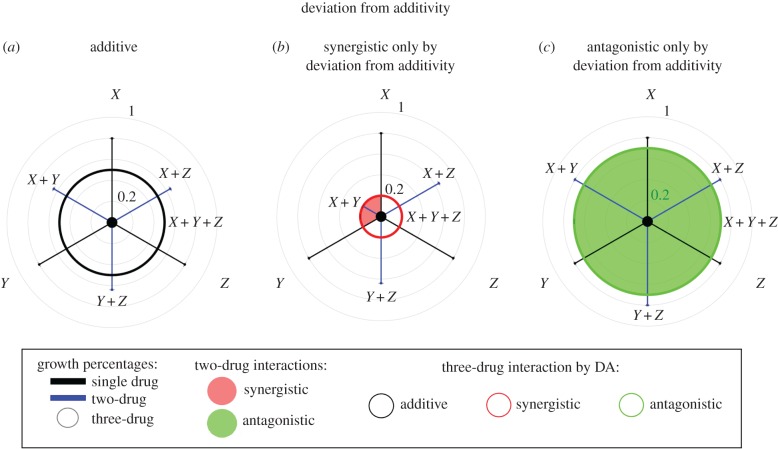
Figure 1.
Schematic of triple-drug combination effects according to DA. Relative growth rates for bacteria populations in one-, two- and three-drug combinations are shown as increasing from 0% growth in the centre to 100% growth (no-drug control) at the largest outer circle of the polar graph. Growth rate is shown for single-drug (black bars), two-drug (blue bars with corresponding single-drug treatments adjacent) and triple-drug combinations (radius of inner circle). Shading of the inner circle indicates nature of pairwise interactions (red, synergistic; green, antagonistic; no shading, additive). Outline colouring of inner circle indicates measure of DA (black, additive; red, synergistic; green, antagonistic). Three possible triple-drug combination effects are depicted schematically for theoretical drugs X, Y and Z according to measures of DA. (a) Strictly additive interactions of all pairwise combinations and three-drug combination. (b) Synergy of three drugs according to DA. (c) Antagonistic interaction of three drugs according to DA.

