
FIGURE 4:
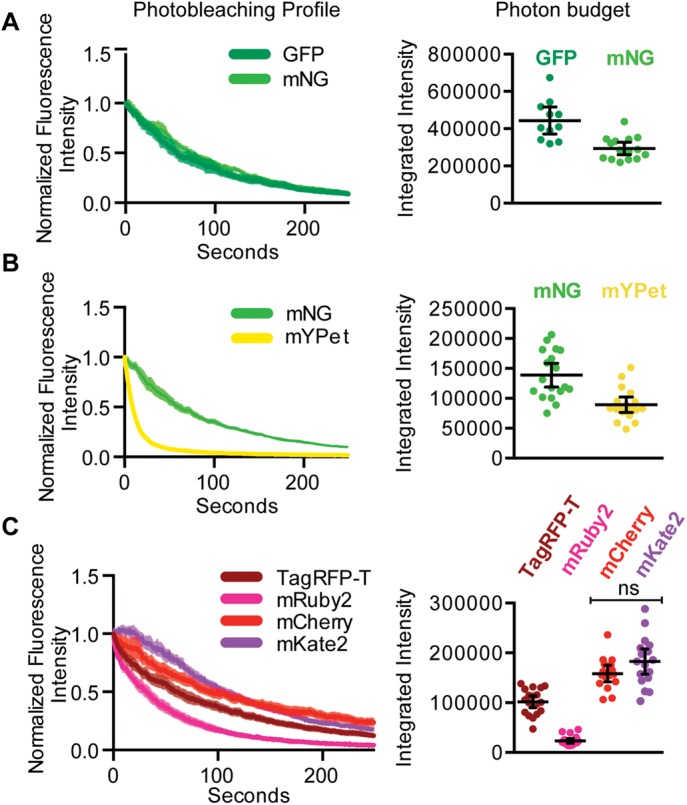
In vivo fluorescent protein photostability. (A–C) Fluorescence intensity was measured in embryos over time. Photobleaching profile and photon budget are compared for membrane-associated fluorescent protein fusions. Each data point represents a single embryo, and the black bars represent the mean and 95% CIs.