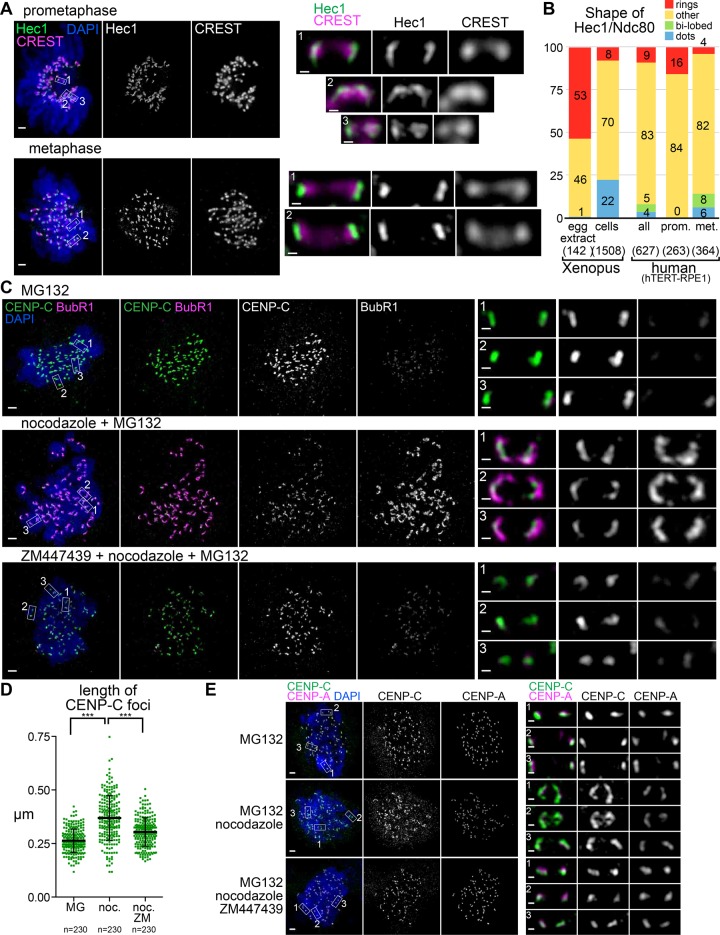
FIGURE 5:
Centromere and core kinetochore configurations are both sensitive to microtubule attachment status. (A) hTERT-RPE1 cells in prometaphase and metaphase. Locations of higher- magnification images of sister kinetochore pairs (scale bars, 0.2 μm) indicated by boxes. (B) Quantification of kinetochore shapes in human cells and Xenopus (C–E) hTERT-RPE1 cells arrested in mitosis for 4 h in the presence or absence of nocodazole and ZM447439 (scale bars, 1 μm). Locations of higher-magnification images of sister kinetochore pairs (scale bars, 0.2 μm) indicated by boxes. Quantification of CENP-C foci lengths from nuclei in C is shown in D.

