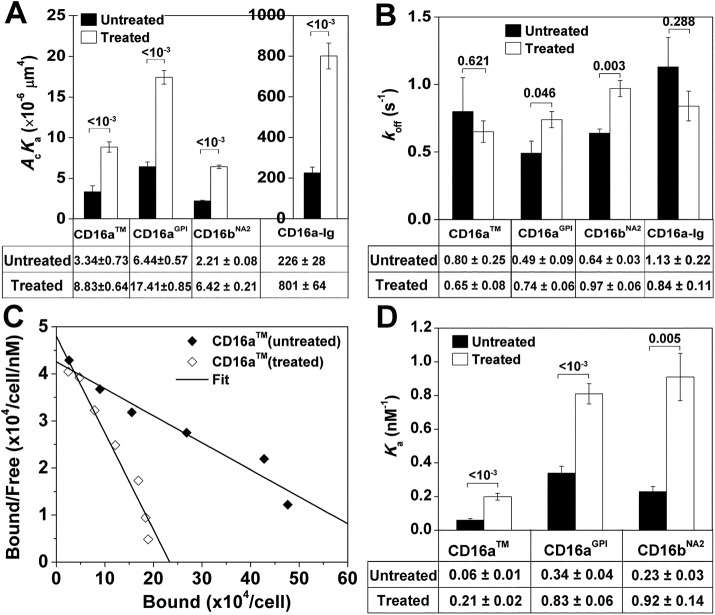
FIGURE 5:
Effects of tunicamycin treatment on CD16–hIgG1 binding. (A) The 2D affinities and (B) off-rates of CD16 isoforms expressed on CHO cell-surface and soluble CD16–Ig chimera for hIgG1 obtained from fitting Eq. 3 to specific adhesion frequencies measured at six contact durations ranging from 0.25 to 8 s (three RBC–CHO cell or RBC–RBC pairs with 50 or 100 contacts each per contact duration) as in Figure 2B. (C) Representative Scatchard plot analysis for saturation binding of CLBFcgran-1 to CD16aTM. (D) The 3D affinities of CD16 isoforms expressed on CHO cell surface for CLBFcgran-1 obtained by Scatchard plot analysis as illustrated in C. In A, B, and D, data both without and with tunicamycin treatment are presented as mean ± SEM. Data values are below the plots; p-values from Student’s t test are above data bars.

