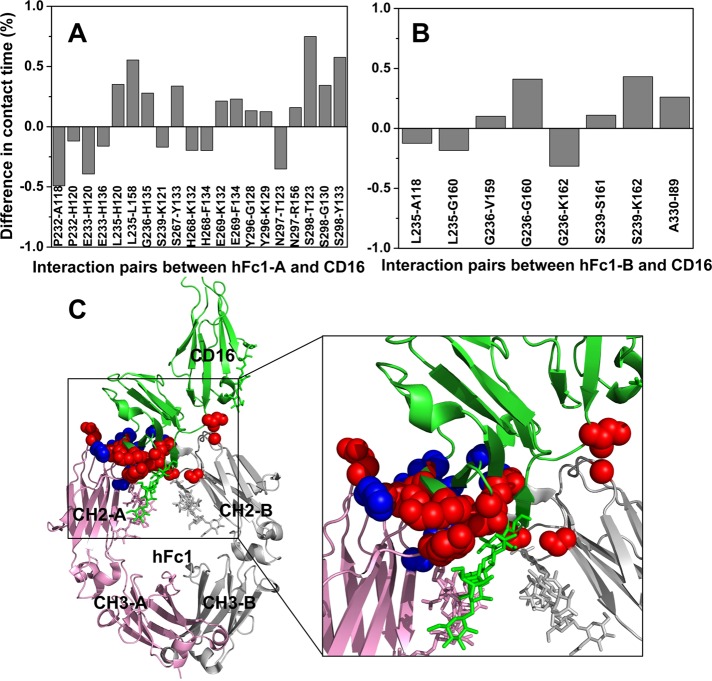
FIGURE 6:
Deglycosylation of CD16 enhances the CD16-hFc1 binding. (A) Difference in contact time between aglycosylated and glycosylated CD16-hFc1 complexes for residue pairs that interact between chain A of hFc1 and CD16. Two residues are defined as in contact if any pair of their heavy atoms of side chains (Cα atom for glycine) are within 4.5 Å distance. Then the contact time is calculated as the fraction of the total time that the two residues are in contact. (B) Difference in contact time between aglycosylated and glycosylated CD16-hFc1 complexes for residue pairs that interact between chain B of hFc1 and CD16. In A and B, only pairs with >0.1 absolute difference are shown. The calculations were done on the last 40 ns of the simulations, with one snapshot per 10 ps. (C) Structure of the glycosylated CD16–hFc1 complex (PDB 3SGJ). Chains A and B of hFc1 are shown in pink and gray, respectively. CD16 is in green. Sticks represent glycans attached to proteins. Red spheres show residues whose interactions strengthened upon deglycosylation; blue spheres show residues whose interactions weakened.

