FIGURE 1:
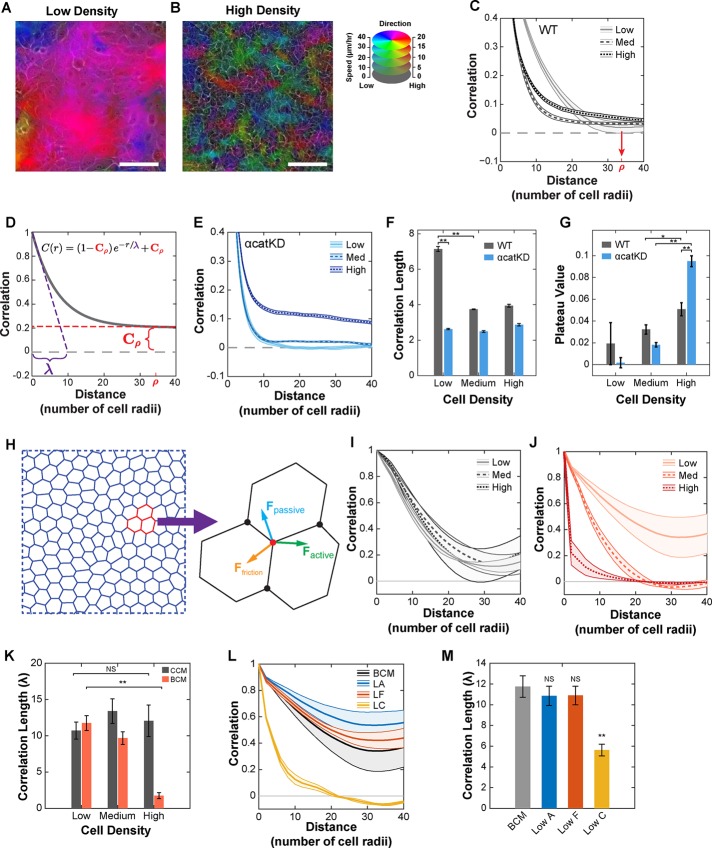
Local and regional organization of collective migration within an epithelium. (A) Heatmap overlay of cell velocity for low-density WT cells with migration direction and speed encoded with color hue and intensity, respectively. (B) Same as A for high-density WT cells. Scale bars, 100 μm (A, B). (C) Radial correlation for WT cells across a range of densities. Red arrow denotes ρ, the distance over which radial correlation decayed to zero for low-density WT cells. (D) Fitting function used to measure correlation length (purple, λ) and plateau value (red, Cρ). (E) Radial correlation for αcatKD cells across a range of densities. (F) Value of correlation length (λ) obtained by fitting curves to Eq. 1. (G) Value of plateau value (Cρ) obtained by fitting curves to Eq. 1. (H) Diagram of the vertex model and vertex force balance used to simulate epithelial migration. (I) Radial correlation curves for simulated epithelial migration using the constant contractility model. (J) Radial correlation curves for simulated epithelial migration using the biomechanical contractility model. (K) Value of correlation length (λ) obtained by fitting constant contractility (CCM) and biomechanical contractility (BCM) correlation curves. (L) Radial correlations for simulated epithelial migration at low density for the biomechanical contractility model (BCM) and variations of the model: low adhesion (LA), low friction (LF), and low contractility coupling (LC). (M) Value of correlation length (λ) for the various models in L. Error bars and envelopes are SEM. For C and E–G, each density is the mean of 14 (WT) or 6 (αcatKD) 2.3-mm2 regions (four 10× fields per region). For I–M, data are mean values from three simulations. See Supplemental Tables S2 and S3 for simulated cell type parameters. Student’s t test was used to assess significance. NS, not significant; *p < 0.05; **p < 0.01. See also Supplemental Videos S1 and S2.

