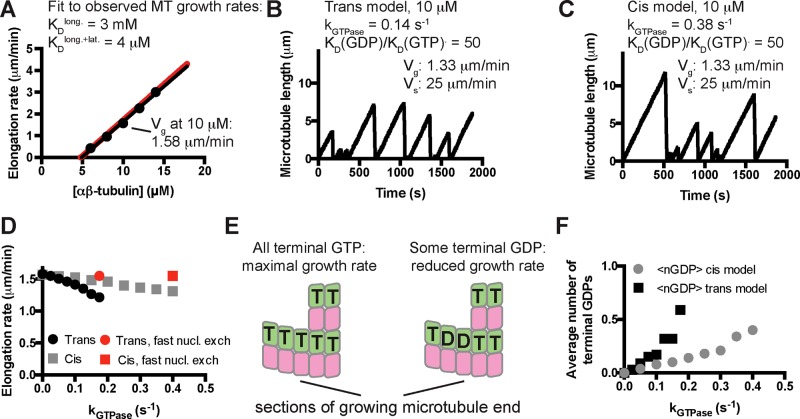
FIGURE 2:
Kinetic Monte Carlo simulations of microtubule dynamics. (A) Simulations with “GTP-only” parameters recapitulate experimentally observed microtubule elongation rates over a range of mammalian αβ-tubulin concentrations (dots: simulated elongation rates; black line: linear fit to the simulated elongation rates; red line: concentration-dependent elongation rates from Walker et al., 1988). (B) After optimizing the GTPase rate constant and the affinity- weakening effect of GDP, the trans model can recapitulate the experimentally observed frequency of catastrophe and rate of shrinking at 10 μM αβ-tubulin. Note that the elongation rate obtained here (1.33 μm/min) is slower than in the GTP only simulations (1.58 μm/min). (C) Same as B, but using a version of cis-acting GTP (Supplemental Figure S1). Compared to the trans model, a faster rate of GTPase activity was required to obtain the measured frequency of catastrophe. A similar GTPase-induced “slowdown” in elongation was observed. (D) Simulations show that for both trans and cis models, the magnitude of the GTPase-induced slowdown increases with the GTPase rate. Red dots indicate growth rates in simulations in which terminal GDP-to-GTP exchange was instantaneous. (E) Exposure of terminal GDP-bound αβ-tubulins might provide an explanation for the GTPase-induced decrease in elongation rates. (F) In both trans and cis simulations, microtubules expose approximately one terminal GDP subunit every three end configurations sampled during a growth phase.

