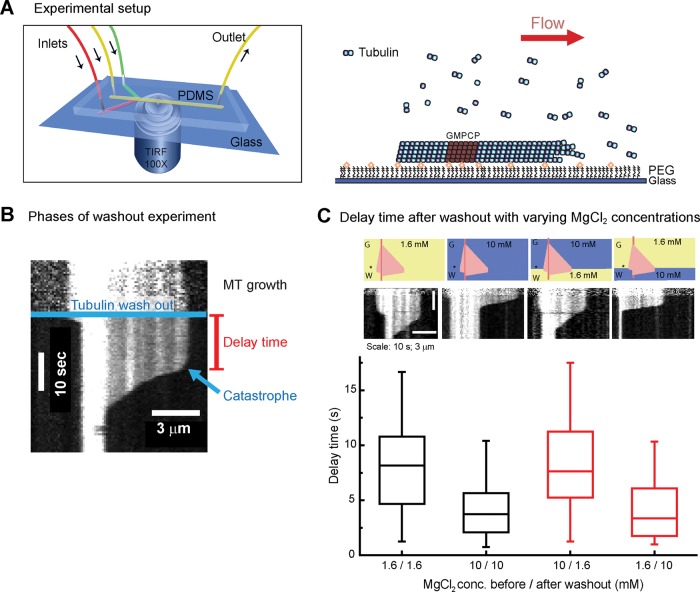
FIGURE 2:
Tubulin washout assay. (A) Microfluidics-assisted tubulin washout setup (left). Microtubules grow from surface-immobilized, GMPCPP-stabilized seeds under constant flow; changing solution allows fast tubulin removal (right). (B) Representative kymograph of a tubulin washout experiment. The microtubule elongates in the presence of 20 μM tubulin (MT growth) until tubulin is washed out (blue line). A delay time of several seconds (red) is observed until catastrophe occurs, followed by fast depolymerization. For clarity, background subtraction was applied using ImageJ (National Institutes of Health, Bethesda, MD). For the definition of the catastrophe criterion, see Supplemental Figure S2. (C) Average delay times of microtubule plus ends after tubulin washout in the presence of varying magnesium concentrations as indicated. Top, schematic drawings with the idealized kymographs illustrating the sequence of magnesium concentrations used; asterisk indicates time of washout. Tubulin washout was performed at 160 s after the start of growth. Middle, representative kymographs for each condition. Bottom, box plot showing the measured average delay times. Tubulin washout was performed in the constant presence of 1.6 (first column) or 10 mM (second column) MgCl2 or the MgCl2 concentration was changed at tubulin washout as indicated (third and fourth columns). n > 51 per condition.

