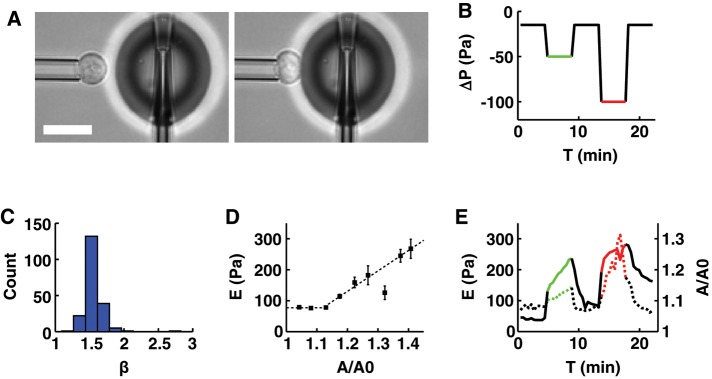
FIGURE 2:
The apparent stiffness of a resting T-lymphocyte increases with apparent membrane surface area. (A) Example of a resting T-lymphocyte being aspirated into a micropipette while its apparent stiffness is measured using profile microindentation. Scale bar, 10 μm. (B) Plot of the aspiration pressure, ΔP, used to hold the resting T-lymphocytes during profile microindentation as a function of time. Each resting T-lymphocyte is indented ∼50 times, once every 30 s. Black, aspiration pressure is −15 Pa; green, −50 Pa; red, −100 Pa. (C) Histogram of the indentation scaling exponent β found during the profile microindentations. We fit the force–indentation curve using the relation F = α δβ, with F the force, δ the indentation, and α and β two fitting parameters. (D) Plot of the apparent stiffness, E, as a function of the normalized apparent membrane surface area, A/A0, where A0 is the initial membrane surface area and A is the membrane surface area at the time when E is measured. Bars represent SD. Five cells and 201 microindentations. The number of cells decreases for large values of A/A0. The three last points to the right correspond to only 5, 7, and 2 microindentations, respectively, compared with >30 on average for the six points to the left. Dotted line represents the best fit using the phenomenological relation E = E0 for A/A0 < 1 + ε and E = E0 + k[A/A0 − (1 + ε)] for A/A0 > 1 + ε. (E) Plot of E (left axis, dotted line) and A/A0 (right axis, continuous line) averaged over five cells, as a function of time.

