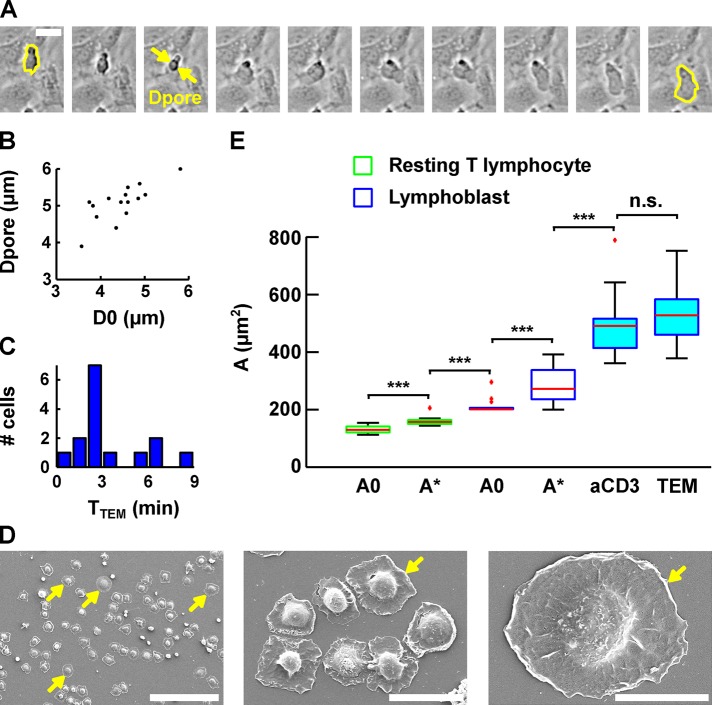
FIGURE 7:
Evolution of lymphoblast membrane surface area during transendothelial migration and cell spreading. (A) Time lapse of a lymphoblast transmigrating between human aortic endothelial cells. Scale bar, 20 μm. Images were taken every 15 s. The projected surface area Sproj is represented in yellow before (leftmost image) and after (rightmost image) transendothelial migration. The pore diameter, Dpore, is estimated by taking the image in which the lymphoblast width is identical above and below the pore (yellow arrows). (B) Dpore during transendothelial migration as a function of the lymphoblast’s projected diameter before transendothelial migration (computed using D0 = Sproj/2π, and D0 is an equivalent diameter for a sphere whose projected area is Sproj). (C) Histogram of the duration of transmigration. The mean duration is 3 ± 2 min (mean ± SD). (D) Scanning electron microscopy images of lymphoblasts spreading on a substrate coated with anti-CD3 plus anti-CD28 activating antibodies. Scale bars, 100 μm, 20 μm, 10 μm (left to right). Yellow arrows indicate spread cells. (E) Boxplots of the apparent membrane surface area of T-lymphocytes under both passive (white-filled box) and active (blue-filled box) deformations. The bottom and top of the box indicate the 25th and 75th percentiles, respectively. Red plus signs indicate outliers. From left to right, resting T-lymphocytes initially (column 1, A0, n = 14) and at rupture (column 2, A*, n = 14) aspirated using a micropipette, lymphoblasts at rest (column 3, A0, n = 14) and at rupture (column 4, A*, n = 14) aspirated using a micropipette, lymphoblasts spread on anti-CD3 plus anti-CD28 monoclonal antibodies (column 5, aCD3, n = 17), and lymphoblasts after transendothelial migration (column 6, TEM, n = 15). ***p < 0.001. n.s., p > 0.05.

