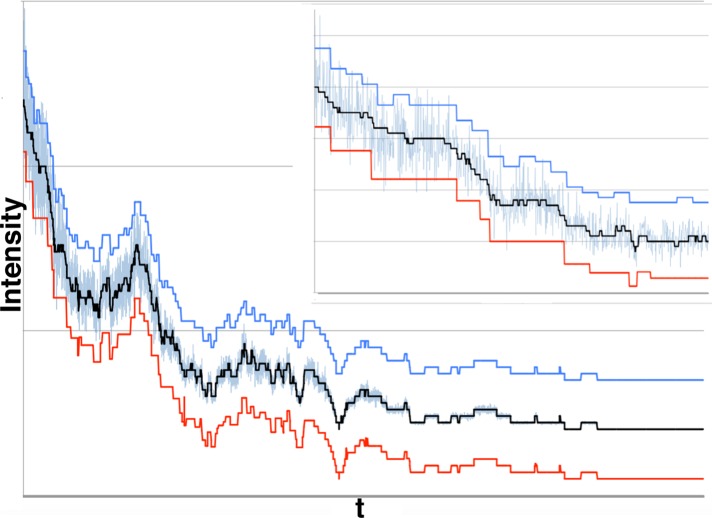
FIGURE 14:
Our algorithm offers an improvement over a recent Tdetector2 algorithm (Chen et al., 2014). In this 10,000–data point data set, 50 fluorophores photobleach to background with μf = 2.0, σf = 0.2, μb = 20.0, and σb = 0.0001. As before, we show the theoretical signal (thick black line) around which we added noise (light blue), the results of the Tdetector2 algorithm (red), and results of our approach (dark blue). The dark blue and red curves are displaced by ±15 fluorescence units, respectively, to facilitate comparison. Both algorithms do very well late in the trace, when noise is relatively low; however, as noise increases, both encounter problems. In particular, both algorithms underfit. For our method, such underfitting is expected due to small-number statistics (see later discussion). However, the Tdetector2 algorithm performs considerably worse. Inset, detail of the first 1000 data points of the trace. Underfitting for both algorithms is obvious, as is the fact that the Tdetector2 algorithm performs significantly worse than ours. We have aSNR = 10–0.1, PRB = 0.92, PRT = 0.81, SEB = 0.34, SET = 0.31, OFB = 22.0, and OFT = 39.1, where the subscripts B and T denote our Bayesian method and the Tdetector2 algorithm results, respectively. Note that this particular synthetic data set was purposefully constructed to be “hard” for our algorithm to process: there are numerous cases in which neighboring fluorescence change events are separated by <50 data points. For aSNR ≤ 0.25, 50 points is the minimum number of data points between steps that permits our algorithm to perform relatively reliably. If the number of data points between steps is smaller, small-number statistics introduces error into our algorithm.

