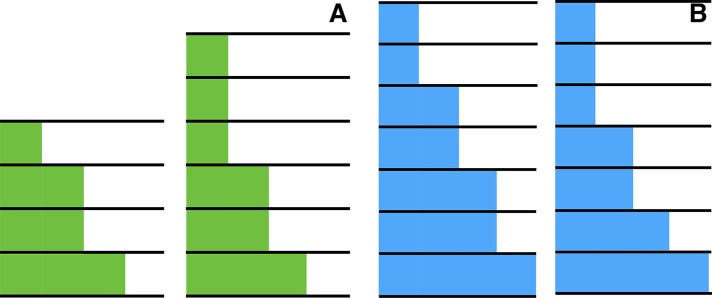
FIGURE 3:
Two models can have the same number of steps and even have those steps occur at identical locations, and yet different m’s and arr’s may fit the data very differently. (A) m refers to the total number of single fluorophore intensity level changes. In both cases, K = 3 (three steps), but on the left, these are made up of a single, a double, and again a single event for a total m = 4, whereas on the right, the three steps are made up of a triple, a double, and a single event, and so m = 6. (B) arr refers to the different ways in which m events can be arranged in K steps. In both cases, K = 4 and m = 7 but arr is different. On the left, the first three steps are double-event ones and the fourth is single, whereas on the right, we have in succession a triple, a double, and two single events. Note that neither m nor arr is location dependent.

