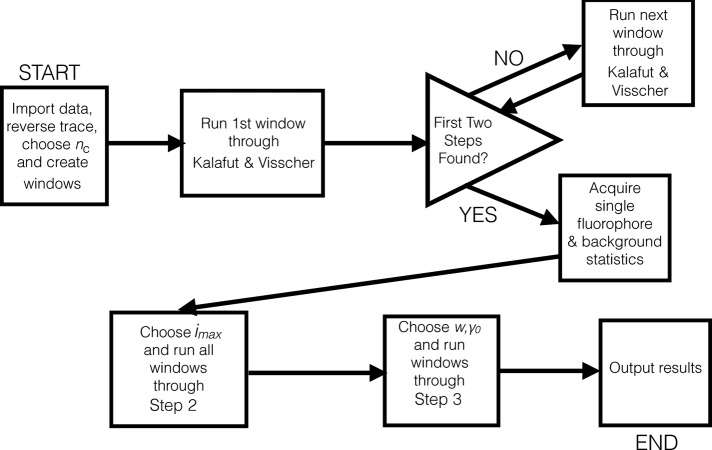
FIGURE 6:
The three steps of our algorithm can be broken down into a step-by-step chart. In this schematic, nc is the window size, imax is the maximum number of fluorophores simultaneously considered in a window, w is the maximum number of single-level fluorescence change events the code will consider (essentially setting m = w, but only within one window), and γ 0 is a hyperparameter cutoff. These four quantities are the user-defined parameters that our approach requires. Note that since the trace has been reversed, the “first” window and the “first” two steps of the algorithm discussed in Kalafut and Visscher (2008) are timewise the last window and the latest two steps in the trace.

