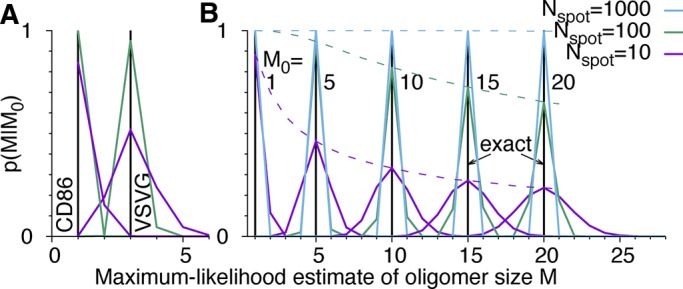
FIGURE 4:

Accuracy of estimated molecule counts M for different oligomer sizes M0 and numbers of spots Nspot analyzed. p(M/M0) is the distribution of M = m + 1 maximizing the likelihood (Eq. 17) in 105 repeated samplings of blinking statistics c(n). (A) Resampled experimental counts for CD86 and VSVG fused to mEos2. (B) Synthetic data for M0 = 1, 5, 10, 15, and 20 mEos2 tags (left to right) in Nspot = 10 (magenta), 100 (green), and 1000 spots (blue). Black vertical lines indicate exact values M0. Dashed lines in B show the probability p(M0/M0) of estimating M0 exactly for different Nspot.
