FIGURE 1:
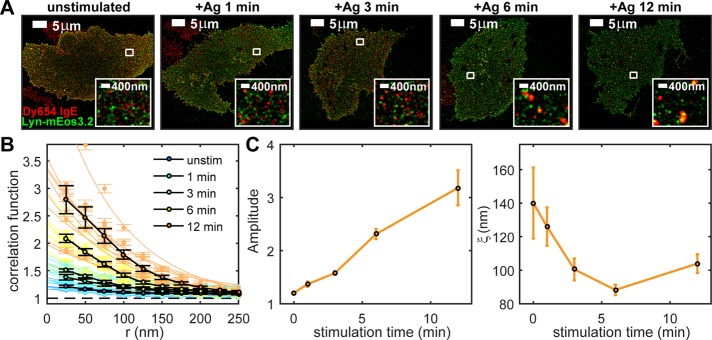
Pair-correlation analysis of two-color FLM images measures stimulation time-dependent nanoscale colocalization of IgE-FcεRI and Lyn. Cells expressing Lyn-mEos3.2 and sensitized with Dy654 IgE are stimulated with 500 ng/ml DNP-BSA for 0, 1, 3, 6, or 12 min, fixed, and imaged as described in Materials and Methods. (A) Representative two-color FLM images of cells for each stimulation time point. Regions indicated by white boxes are magnified in the insets. The map of single-probe localizations obtained through FLM imaging is convolved with 2D Gaussian functions with radii of 50 nm in whole images and 20 nm in insets for display. (B) Individual and average pair cross-correlation functions for cells fixed at each stimulation time point. Individual Lyn/IgE-FcεRI cross-correlation functions are fitted to Eq. 1 as described in Materials and Methods. Fits of these individual cross-correlation functions to Eq. 1 are used to extract the fit parameters A (amplitude) and ξ (correlation length, in nanometers) for each correlation function. Measured individual cross-correlations with fits are shown in light colors; averages of the individual cross-correlation functions measured at a given time point are shown in black (eight or nine cells per time point). (C) Fit parameters A and ξ generated by the fit of individual Lyn/IgE-FcεRI cross-correlation functions averaged and plotted as a function of stimulation time. Error bars represent SEM.

