
FIGURE 2:
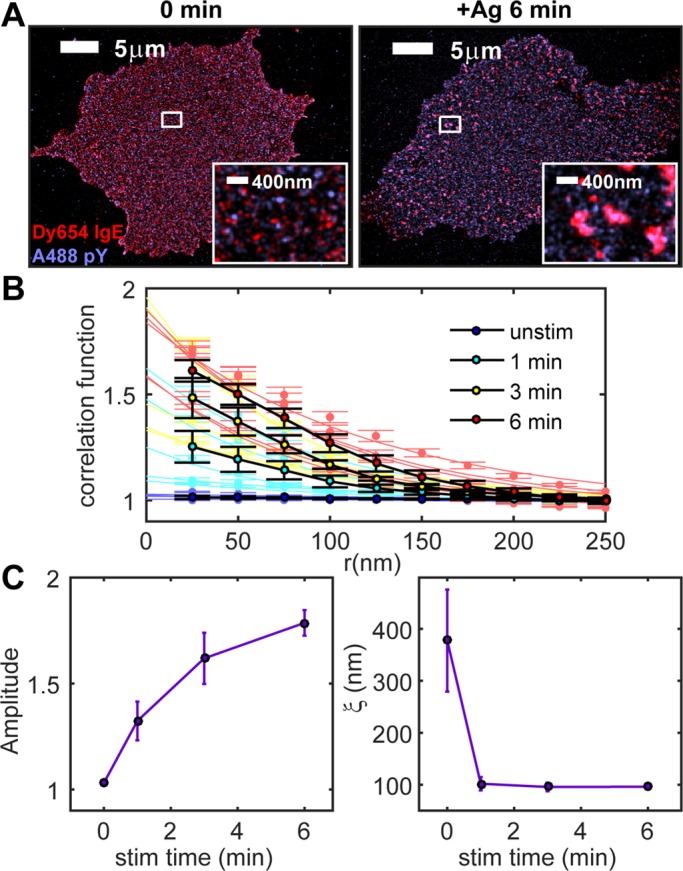
Phosphotyrosine/IgE-FcεRI cross-correlation amplitude increases with stimulation time. (A) Two-color FLM images of A488 anti-phosphotyrosine and Dy654 IgE in cells fixed after stimulation for 0 (left) or 6 min (right). Regions indicated by white boxes are magnified in the insets. (B) Individual and average pair cross-correlation functions for cells imaged for each stimulation time point. Individual cross-correlation functions are fitted to Eq. 1 as in Figure 1. Measured individual cross-correlations with fits are shown in light colors; average cross-correlation functions are shown in black (six cells per time point). (C) Cross-correlation fit parameters A and ξ as a function of stimulation time for A488 phosphotyrosine/Dy654 IgE-labeled cells stimulated for 0, 1, 3, or 6 min and averaged over multiple cells for each time point.