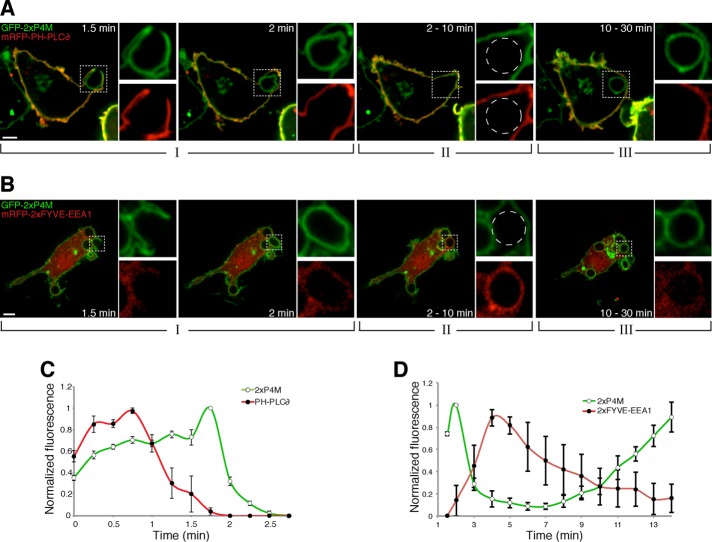
FIGURE 2:
Comparison of the changes in PtdIns4P content to those of PtdIns(4,5)P2 and PtdIns3P. (A) Time-lapse gallery of confocal micrographs of RAW264.7 cells coexpressing GFP-2xP4M and mRFP-PH-PLCδ, a PtdIns(4,5)P2 biosensor, during phagocytosis of IgG-SRBCs. (B) Time-lapse gallery of confocal micrographs of cells coexpressing GFP-2xP4M and mRFP-2xFYVE-EEA1, a PtdIns3P biosensor, during phagocytosis of IgG-SRBCs. Insets, magnifications of the area delimited by dotted white boxes; dashed circles show the location of the phagosome. Scale bars, 5 μm. (C) Time course of the changes in PtdIns4P and PtdIns(4,5)P2 during phagosome formation. The intensity of GFP-2xP4M fluorescence in the phagosome was measured and normalized to the plasmalemmal intensity; to enable comparison between cells and between experiments, the data are expressed relative to the maximum value (green line, white circles). A similar analysis was applied to mRFP-PH-PLCδ (red line, black circles), a PtdIns(4,5)P2 biosensor. (D) Time course of the changes in PtdIns4P and PtdIns3P during phagosome formation and maturation. PtdIns4P was monitored as before, using GFP-2xP4M. mCh-FYVE-EEA1 was used as a PtdIns3P probe; phagosomal intensity was measured after subtracting cytosolic fluorescence. Data are expressed relative to the maximum value. Values are means ± SEM of three and five independent experiments, respectively. Note the different time scales used in C vs. D. Initial contact between cells and IgG-SRBC was considered as time 0.

