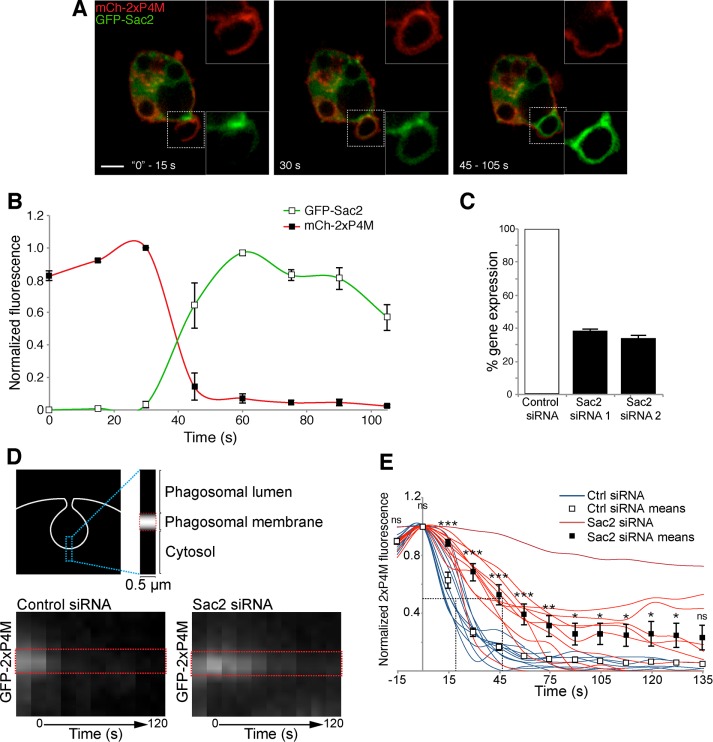
FIGURE 4:
Sac2 recruitment and hydrolysis of PtdIns4P. (A) Confocal micrographs of RAW264.7 cells coexpressing mCherry-2xP4M, GFP-Sac2, and CFP-Rab5 during phagocytosis of IgG-SRBCs (the CFP channel is not shown). Insets, magnifications of the area delimited by dotted white boxes. Scale bar, 5 μm. (B) Time course of the changes in PtdIns4P and Sac2 during phagosome formation, from experiments like the one in A. PtdIns4P was monitored using mCherry-2xP4M and normalized to plasmalemmal mCherry-2xP4M intensity (red line, black squares); GFP-Sac2 fluorescence in the phagosome was calculated after subtraction of GFP-Sac2 cytosolic intensity (green line, white squares); data are expressed relative to the maximum value. Values are means ± SEM from three independent experiments. Pseudopod extension is considered as time 0. (C) Sac2 silencing efficiency of siRNA1 and siRNA2 in RAW264.7 cells measured by quantitative real-time PCR after reverse transcription; means ± SDs of three independent experiments and normalized to cells treated with nontargeting siRNA (control). (D) Time course of disappearance of PtdIns4P, assessed by kymography using GFP-2xP4M, during the early stages of phagocytosis. Top, region of the phagosome analyzed over time. Bottom, representative kymographs illustrating the disappearance of GFP-2xP4M from the base of the nascent phagosome over 120 s. The closure of the phagosome was considered as time 0. Images in A and D are representative of the distribution noted during the indicated time intervals after the onset of phagocytosis. (E) GFP-2xP4M phagosomal intensity was measured and normalized to GFP-2xP4M plasmalemmal intensity; data are expressed relative to the maximum value. Blue lines illustrate the kinetics of GFP-2xP4M disappearance in cells treated with nontargeting (control) siRNA; red lines illustrate cells treated with Sac2-targetted siRNAs. White and black squares and associated bars show the means ± SE of control and Sac2-knockdown (using siRNA1 and siRNA2) cells, respectively, from at least 10 phagosomes from three independent experiments. The intersections of the dotted lines indicate the t1/2 values of decay. *p ≤ 0.05, **p ≤ 0.01, ***p ≤ 0.005, and ns, not significantly different, relative to the nontargeting control.

