FIGURE 6:
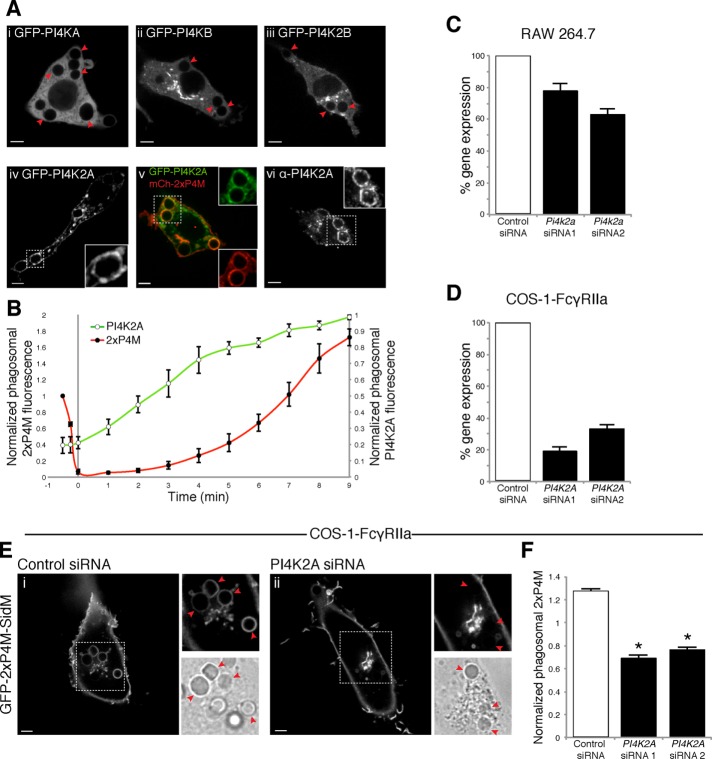
PI4K2A recruitment and generation of PtdIns4P in maturing phagosomes. (A) Confocal sections of RAW264.7 cells expressing (i) GFP-PI4KA, (ii) GFP-PI4KB, (iii) GFP-PI4K2B, or (iv) GFP-PI4K2A or (v) coexpressing GFP-PI4K2A and mCh-2xP4M. (vi) Immunostaining of PI4K2A. Micrographs i–vi were acquired 20 min after initiation of phagocytosis. Insets, magnifications of the area delimited by dotted white boxes. (B) Time course of acquisition of PI4K2A and PtdIns4P during phagocytosis. PI4K2A was monitored measuring phagosomal GFP-PI4K2A and normalized to the mean fluorescence intensity of GFP-PI4K2A in the entire cell (green line, white circles). Data are expressed relative to the maximum value. PtdIns4P was monitored measuring phagosomal mCh-2xP4M and normalized to plasmalemmal mCh-2xP4M (red line, black circles). Data are expressed relative to the value upon phagosomal closure. Time 0 refers to the point when the PtdIns4P originally visible in the early phagosome disappeared entirely. (C, D) PI4K2A silencing efficiency in RAW264.7 (C) and COS-1-FcγRIIa (D) cells, measured by quantitative real-time PCR after reverse transcription; results were normalized to control siRNA cells and are shown as means ± SD of at least three independent experiments. (E) Confocal micrographs of COS-1-FcγRIIa cells expressing GFP-2xP4M treated with nontargeting (control) siRNA (left) and PI4K2A siRNA (right) after 40 min of phagocytosis. (F) Fluorescence of phagosome-associated GFP-2xP4M normalized to plasmalemmal GFP-2xP4M in cells treated with nontargeting (control) siRNA (open bar) and PI4K2A siRNAs (black bars). Data are means ± SEM of four independent experiments of at least 23 phagosomes each. Red arrows indicate phagosomes. *p < 0.05. Scale bars, 5 μm.

