FIGURE 5:
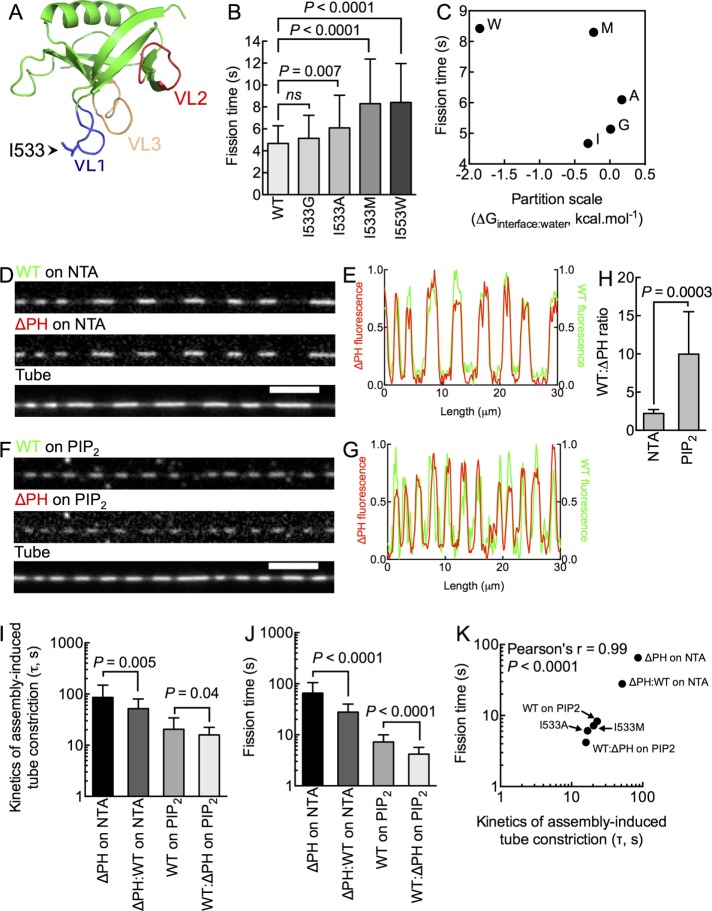
Determinants for efficient catalysis of membrane fission. (A) Structure of the dynamin1 PHD (Protein Data Bank code: 1DYN) indicating the position of VL1, 2, and 3 and the I533 residue at the tip of VL1. (B) Fission time for I533 substituted with different residues. Data represent mean ± SD (n > 40, N = 3, Student’s t test). (C) Lack of correlation between residue hydrophobicity (Wimley and White scale) and fission time. Fluorescence micrographs (D, F) and line profiles (E, G) of Alexa 647–labeled WT (green) and Alexa 488–labeled ΔPH (red) scaffolds (white arrowheads) coassembled on NTA-containing (D) and PIP2-containing (F) tubes. (H) WT:ΔPH fluorescence ratio on NTA- and PIP2-containing tubes. Data represent mean ± SD (n > 10 scaffolds, N = 1, Student’s t test). Time constants of scaffold assembly–induced tube constriction (I) and fission time (J) for pure (ΔPH or WT) and mixed (ΔPH:WT) scaffolds. Data represent mean ± SD (n ≥ 22, N = 3, Student’s t test). (K) Correlation between time constant (τ) of assembly-induced tube constriction and fission time.

