FIGURE 3:
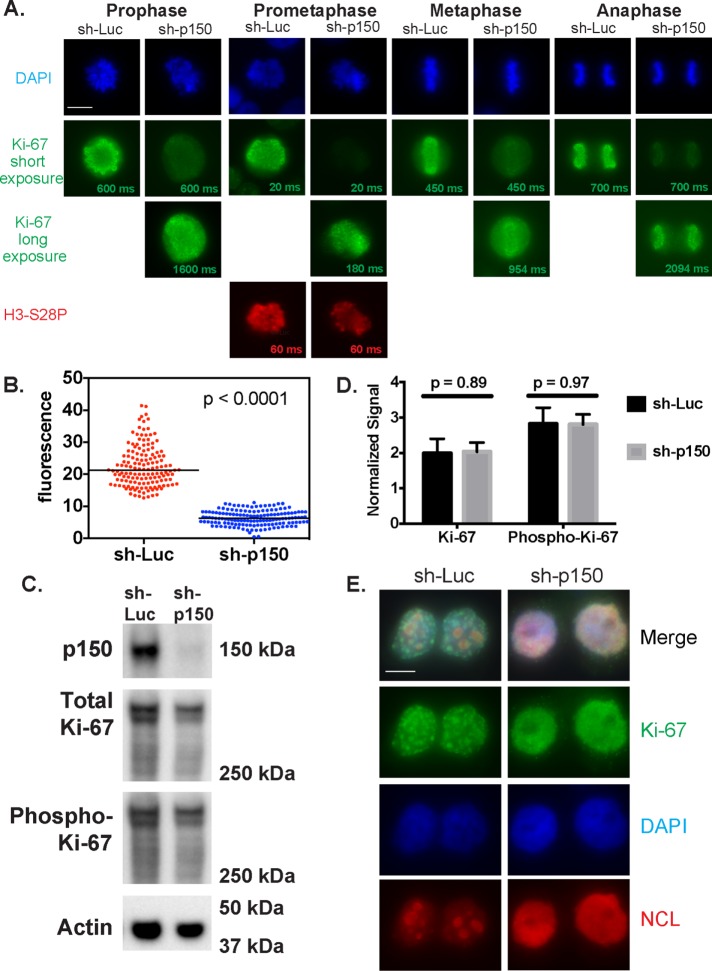
p150 regulates Ki-67 localization during mitosis and early G1 phase. (A) HeLa S3 cells from the indicated cell cycle stages expressed an shRNA directed against luciferase (sh-Luc) or p150 (sh-p150) for 72 h and were stained with DAPI to visualize DNA (blue) and antibodies against Ki-67 (green). Exposure times for Ki67 are indicated on each image; in the sh-p150–expressing cells, different exposure times are shown to illustrate reduced Ki-67 accumulation on the PCL. As a positive control for antibody accessibility, cells in prometaphase were also stained with antibodies recognizing the mitotic marker histone H3-S28-phosphate (red). Scale bar, 10 μm. (B) Quantified corrected total cellular fluorescence of cells from three biological replicate experiments of cells expressing sh-luc (red, N = 150) or sh-p150 (blue, N = 147). (C) Immunoblot analysis of extracts from shRNA-expressing cells described in A arrested in mitosis (12 h in 100 ng/ml nocodazole, followed by shaking off mitotic cells). Blots were probed with antibodies recognizing p150 (top), Ki-67 (upper middle), phospho-Ki-67 (lower middle), and actin (loading control; bottom). Numbers on the right indicate migration of marker proteins in kilodaltons. (D) Quantification of the Ki-67 and phospho-Ki-67 blots from C normalized to actin signal (N = 3). Quantification was performed using the Bio-Rad ChemiDoc system. (E) HeLa S3 cells that expressed an shRNA directed against luciferase (sh-Luc) or p150 (sh-p150) for 72 h were synchronized in mitosis (12 h in 100 ng/ml, nocodazole followed by shaking off), and released into drug-free medium for 2 h to enrich for early G1 cells. Cells were stained with DAPI to visualize DNA (blue) and antibodies against Ki-67 (green) and NCL (red). Scale bar, 10 μm.

