FIGURE 4:
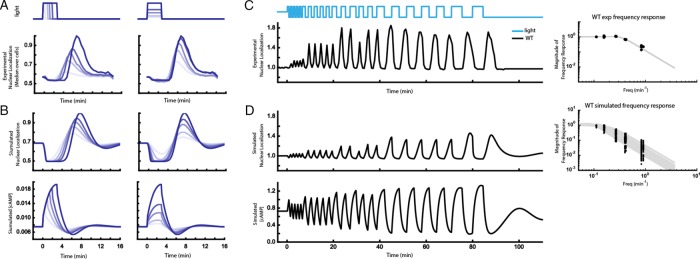
High-precision control of cAMP using bPAC allows for systematic characterization of the PKA system using pulse width–, amplitude-, or frequency-modulated input signals. (A) Peak nuclear localization of Msn2-mCherry increases with blue light duration (left) and amplitude (right) in cells expressing bPAC. Experimental WT data collected at 30-s intervals for light durations of 0.5, 1, 1.5, 2, and 3 min with amplitude fixed at 40 μW/mm2 (left) and light amplitudes of 8, 10, 16, 20, and 40 μW/mm2 with duration fixed at 3 min (right). (See also Supplemental Figure S8.) Plots show median values over ∼900 cells normalized to the maximum observed median value for comparison of responses across different light doses. (B) Top, the model predicts that nuclear localization shows a trend similar to the experimental data of A when light amplitude or duration increases (parameter set 0 from Supplemental Data Set S3; see also Supplemental Figure S7). Data normalized by maximum value. Bottom row, maximum simulated cAMP concentration increases with both light duration and amplitude. (C) Left, mean Msn2-mCherry nuclear localization after blue light illumination at different pulse frequencies. Right, peak mean Msn2 nuclear localization at each frequency (black dots) with fit to second-order transfer function (gray lines). (D) Left, model prediction of the frequency sweep experiment in C for a representative set of parameters (parameter set 17 in Supplemental Data Set S3). Right, peak Msn2 nuclear localization at each frequency for representative parameter sets (black dots), with fits to second-order transfer function (gray lines).

