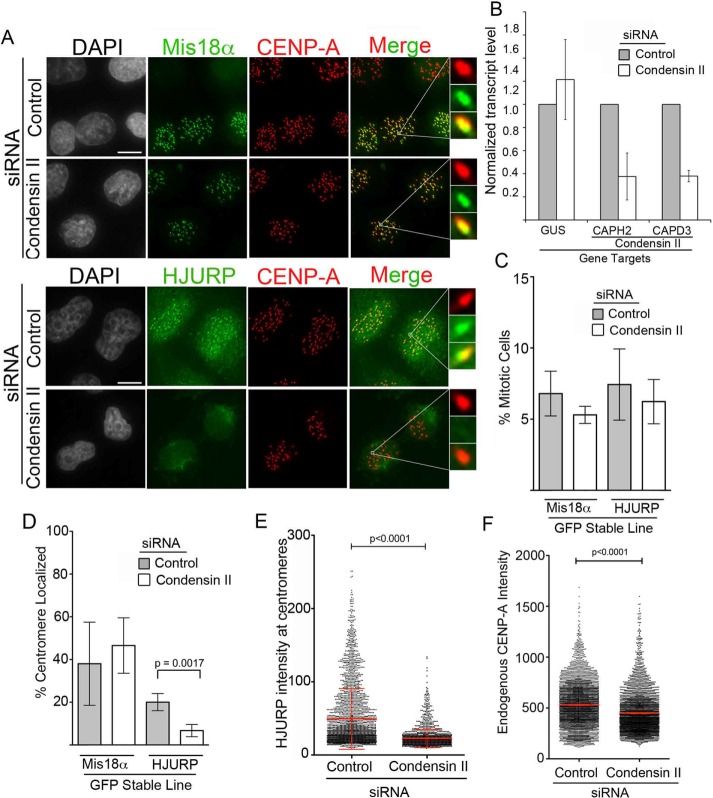
FIGURE 5:
Condensin II depletion reduces HJURP centromeric recruitment. (A) Representative images of Mis18α-GFP HeLa or HJURP-LAP HeLa-TRex stable lines treated with negative control siRNA or CAPH2 plus CAPD3 (condensin II) siRNA for 48 h. Insets highlight centromere-localized examples for Mis18α-GFP and HJURP-GFP. Cells were fixed and then stained with an antibody to endogenous CENP-A. Scale bar, 5 μm. (B) Quantitative PCR analysis of CAPH2 and CAPD3 transcript levels relative to negative control siRNA after 48-h siRNA treatment. GUS was used as an endogenous control transcript. Error bars represent SD. Three biological replicates. (C) Graph displaying percentage of mitotic cells from experiments in A. Error bars represent SD. p = 0.5079 by Kruskal–Wallis test followed by Dunn’s multiple comparison test. Three biological replicates. (D) Quantification of experiment in A. Graph displays the percentage out of ≥100 cells of either Mis18α-GFP or HJURP-GFP centromere-localized cells after negative control or CAPH2 plus CAPD3 (condensin II) siRNA. Error bars represent SD. p = 0.0017 by two-tailed t test. Three biological replicates. (E) Graph of HJURP-LAP intensities of individual centromeres in HJURP-LAP stable line after 48 h of control or condensin II (CAPH2 and CAPD3) siRNA; >2000 centromeres measured per condition. p < 0.0001 by Mann–Whitney test. (F) Endogenous centromere CENP-A intensities in LAP-HJURP HeLa-TRex stable lines treated for 48 h with control or condensin II (CAPH2+CAPD3) siRNA; >3500 centromeres/condition, three biological replicates. Red line represents mean. p < 0.0001 by Mann–Whitney test.

