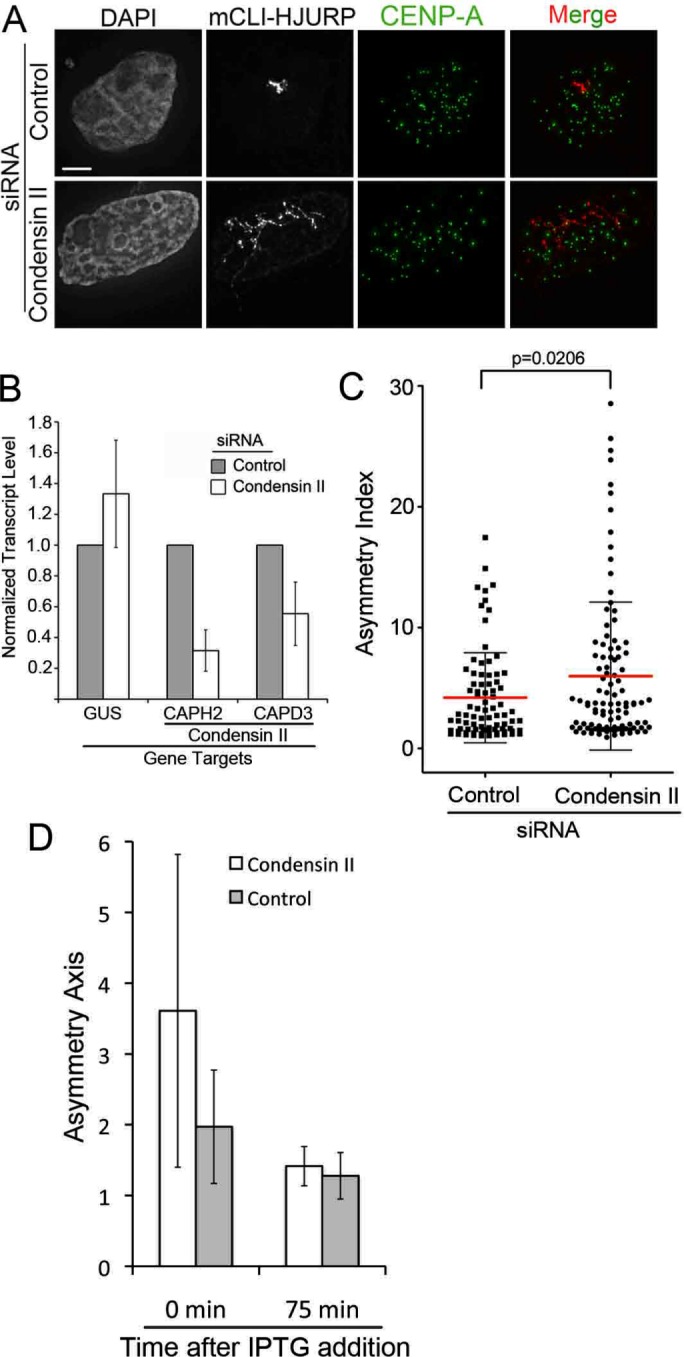
FIGURE 7:

Condensin II tempers HJURP chromatin decompaction capabilities. (A) Representative images of U2OS-LacO cells transfected with mCLI-HJURP and then treated with either negative control siRNA or CAPH2 plus CAPD3 (condensin II) siRNA for 48 h. Cells were preextracted and then fixed and stained with a CENP-A antibody. Scale bar, 5 μm. (B) Quantitative PCR analysis of CAPH2 and CAPD3 transcript levels relative to negative control siRNA after 48-h siRNA treatment. GUS was used as an endogenous control transcript. Error bars represent SD. Three biological replicates. (C) Asymmetry index measurements of experiments in A. Bar represents the mean, and whiskers mark the SD. p = 0.0206 by two-tailed t test; 30 arrays/condition, three biological replicates. (D) Graph of average asymmetry axis values from U2OS-LacO cells expressing mCLI-HJURP and GFP-TetR after 48 h of either control or condensin II siRNA. Cells were treated with 5 mM IPTG to remove mCLI-HJURP from the LacO array for the indicated time points; 20 arrays per time point per condition. Corresponding representative images are in Supplemental Figure S7.
