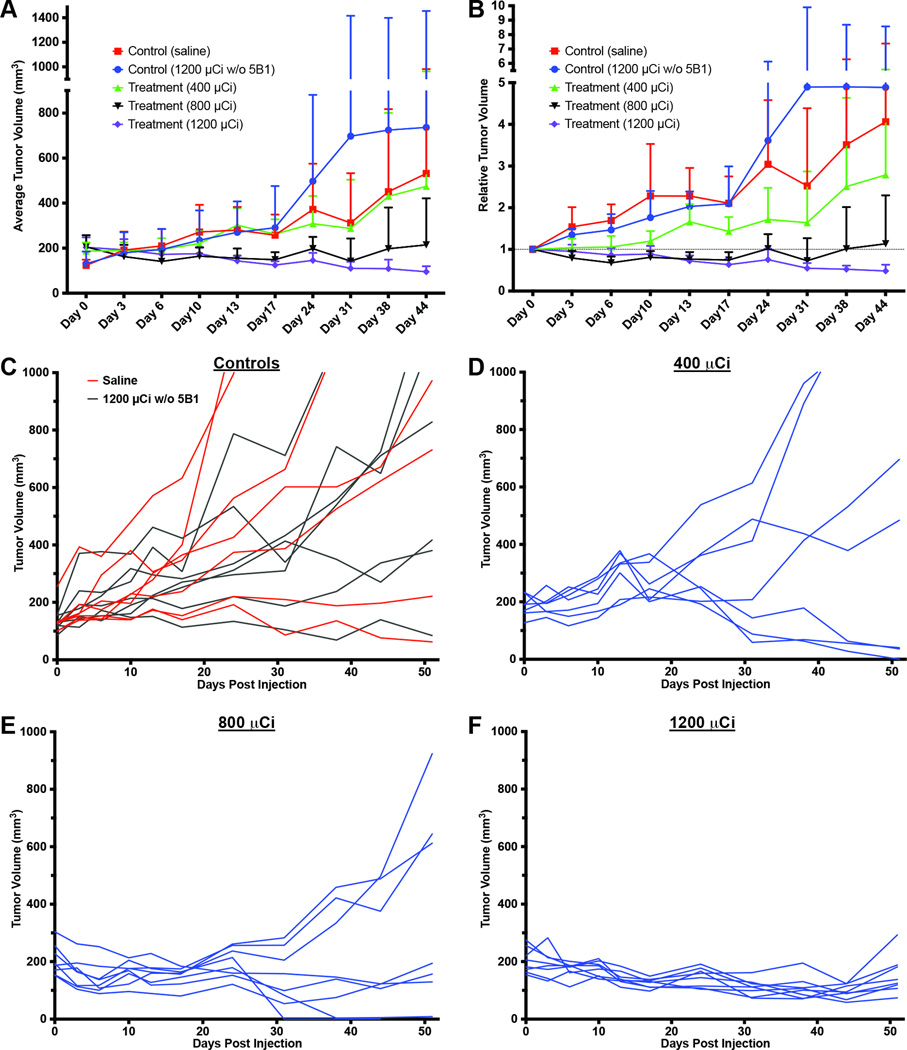
Figure 3.
Plots of the average tumor volume (A) and relative tumor volume (B) for each cohort of mice during the first 31 days of the PRIT study are shown with error bars denoting standard deviation. Line graphs mapping the response of each individual mouse over entire course of the PRIT study are shown for the control groups (C) as well as each therapy cohort (D–F).

