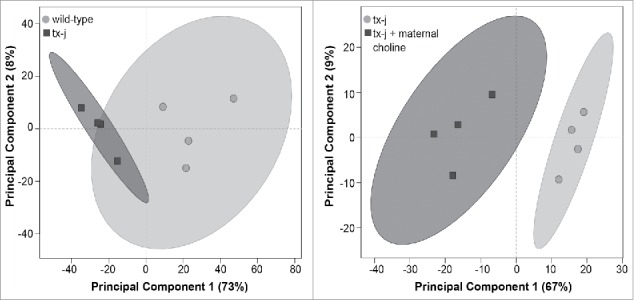
Figure 2.

Principal component analysis scores plot of significantly differentially expressed genes in fetal liver. Each symbol represents a mouse. Symbols that are closer to one another are more similar. Ellipses represent 95% confidence intervals based on Hotelling's T2 statistic.
