
Figure 4.
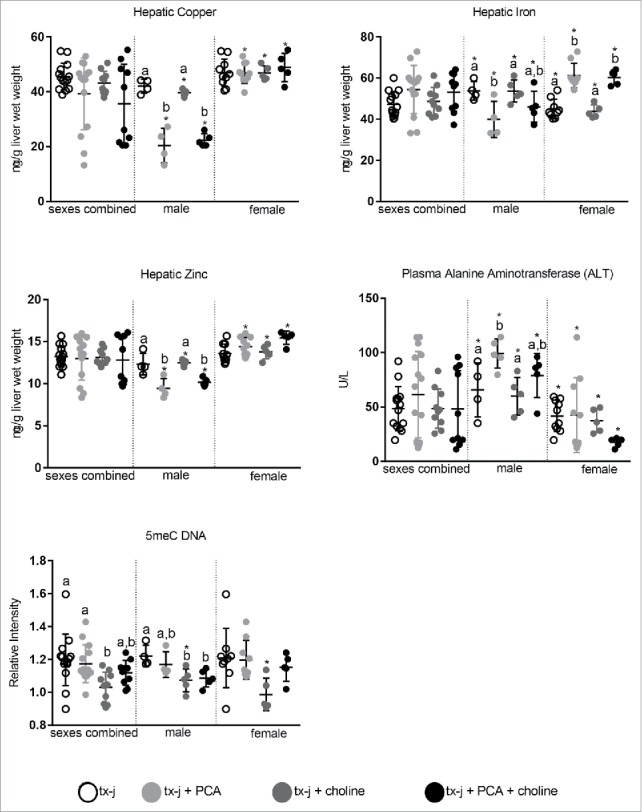
Hepatic copper, iron zinc concentrations, plasma triglycerides and ALT, and global hepatic DNA methylation. Results are expressed as mean ± standard deviation. Between group differences were analyzed by 1-way ANOVA; values with different letter symbols are significantly different (P < 0.05) from each other. Differences between sexes in the same treatment group were analyzed by Student's t-test; values with an asterisk (*) are significantly different (P < 0.05) between sexes.