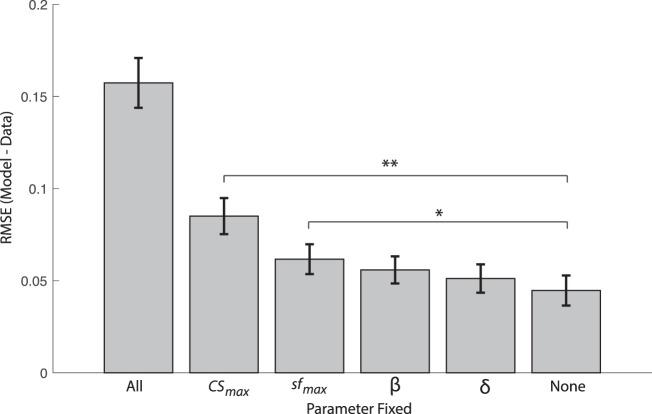
Figure 2.
Bar plot showing the group mean of model-fitting errors, quantified as the root-mean-squared error, between logCS data and the best-fitting truncated log-parabola function in which select parameters were fixed to the group mean. “All” represents the case in which all parameters are fixed to group mean and none are free to vary in fitting individual-subject data (an upper bound on modeling errors). “None” represents the case of the full model with four free parameters (a lower bound on modeling errors). Each other case represents a partial model with three free parameters in which the designated parameter was fixed to the group mean. Error bars represent standard error of the mean. *p < 0.05, **p < 0.01.

