Figure 3.

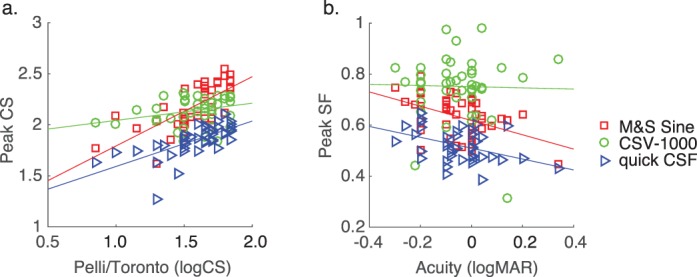
Scatterplots showing, for three different CSF tests, the relationships (a) between letter CS and fitted peak CS parameter and (b) between far acuity and fitted peak SF parameter. Lines represent least-squares linear model fits to the data.

Scatterplots showing, for three different CSF tests, the relationships (a) between letter CS and fitted peak CS parameter and (b) between far acuity and fitted peak SF parameter. Lines represent least-squares linear model fits to the data.