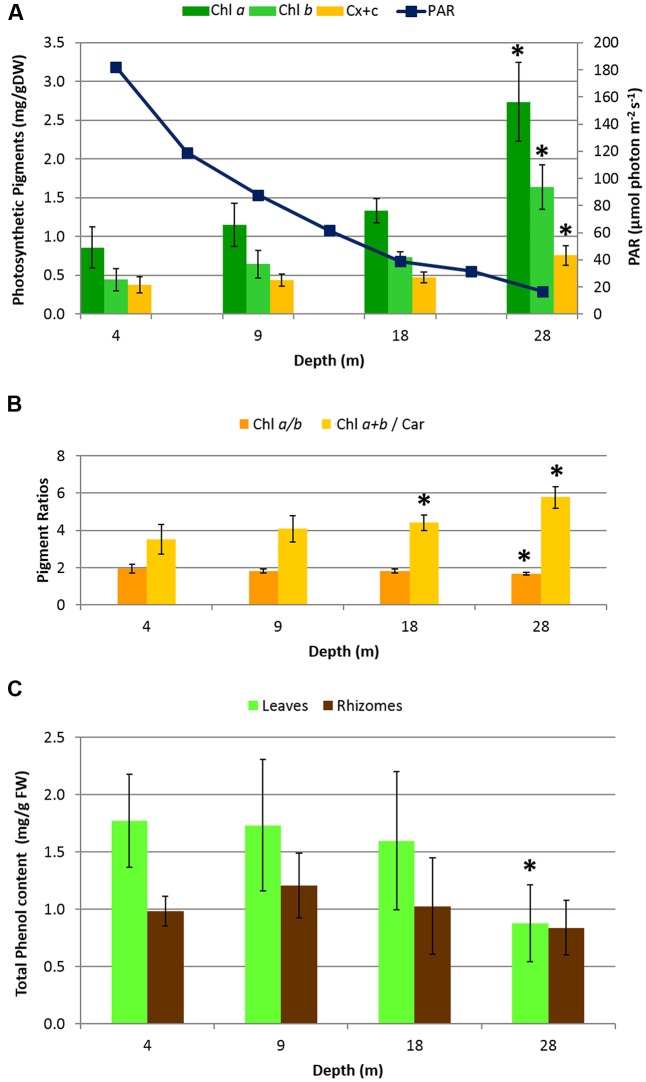
FIGURE 2.
Biochemical descriptors in H. stipulacea plants collected along a depth gradient. (A) Mean photosynthetic pigment content in leaves (Chl a = Chlorophyll a; Chl b = Chlorophyll b; Car = total Carotenoids) and PAR measurements (taken along the 4–28 depth gradient, at noon, using the 2π-quantum sensor of the Diving-PAM fluorometer). (B) Pigment ratio values. (C) Mean total phenol content in leaves and rhizomes. Error bars represent standard deviations (n = 8). Significant differences among depths based on post hoc Tukey’s test are indicated with asterisks.

