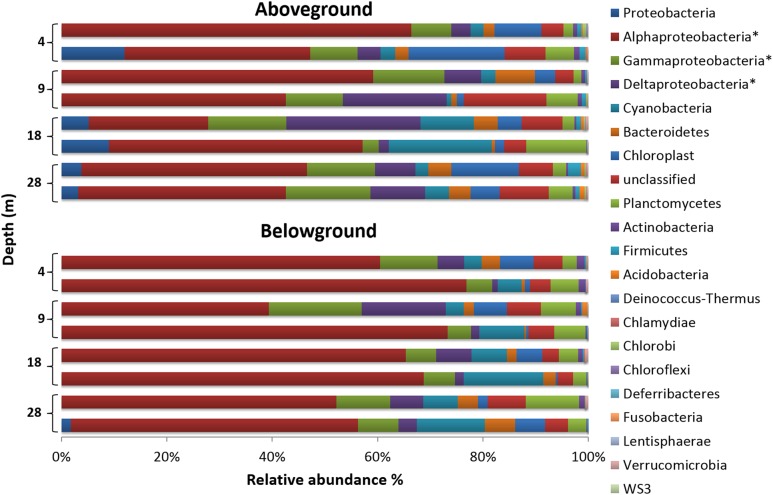
FIGURE 3.
Phylum-level composition of bacterial communities associated with H. stipulacea along a depth gradient. For a better representation of the phylum Proteobacteria, its three most abundant classes (∗) are also shown. Bar charts display compositional data of two replicate samples per depth and plant compartment, using the normalized dataset.

