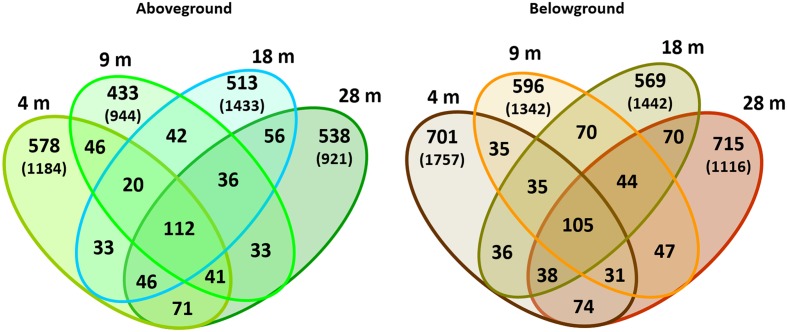
FIGURE 4.
Venn diagrams of bacterial OTUs associated with H. stipulacea by depth. OTUs (specific and shared) associated with aboveground and belowground plant parts at 4, 9, 18, 28 m. Values represent two replicates per depth, using the normalized dataset. In brackets: total number of OTUs found in each plant compartment per depth using the normalized dataset.

