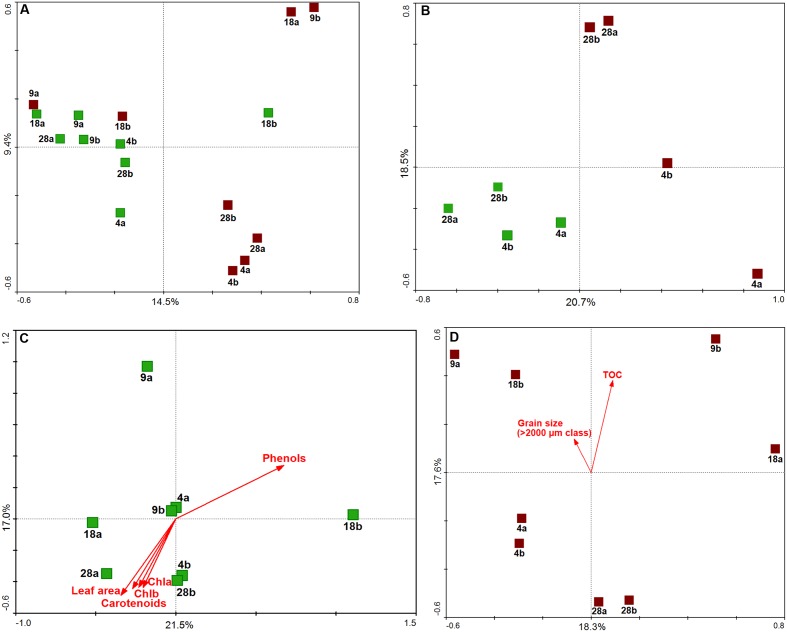
FIGURE 5.
Multivariate analysis of H. stipulacea-associated bacterial communities along a depth gradient (4–28 m). Principal Component Analysis (PCA) results performed on Hellinger-transformed data using scaling on sample distances are shown as: (A) ordination of all samples, (B) ordination of only 4 and 28 m samples, (C) ordination of aboveground samples, (D) ordination of belowground samples. Aboveground samples are in green, belowground samples in brown; sample labels refer to the depths (4, 9, 18, 28 m) and replication units (a,b). Samples were positioned in the ordination diagram according to their community dissimilarity, based on Euclidean distances, calculated from OTU data. In the ordination diagrams, values of plant descriptors (C) and environmental variables (D) are represented by arrows, displayed passively in the ordination space (i.e., not influencing the position of the samples). The ordering of samples, according to increasing values of each descriptor/variable, can be approximated by perpendicularly projecting sample points onto the respective arrows. The percent of explained variance for each principal componente, corresponding to the amount of variation in OTU data, is reported.

