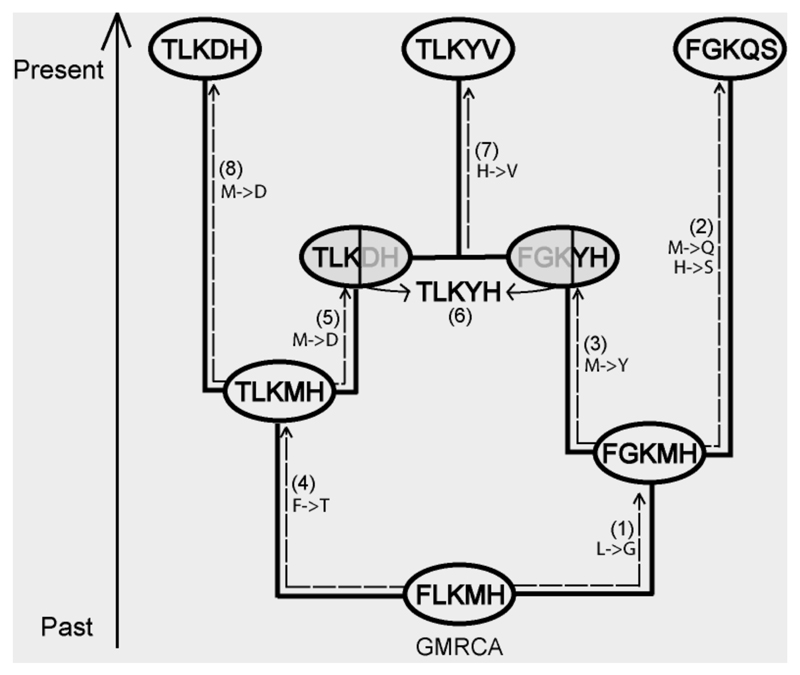
Figure 1.
An example of protein evolution along the ARG. White and grey circles correspond to coalescence and recombination parental nodes, respectively. (1) Starting from the GMRCA, the protein is evolved along branches according to the SCS substitution model and the branch lengths. (3) The process encounters a recombinant node and because its parental node has not been assigned to a protein yet, the evolutionary process continues towards other direction (4). (5) Later, the process encounters the parental recombinant node, and because the other parental has already been assigned to a protein, (6) it combines the two proteins according to the recombination breakpoint.

