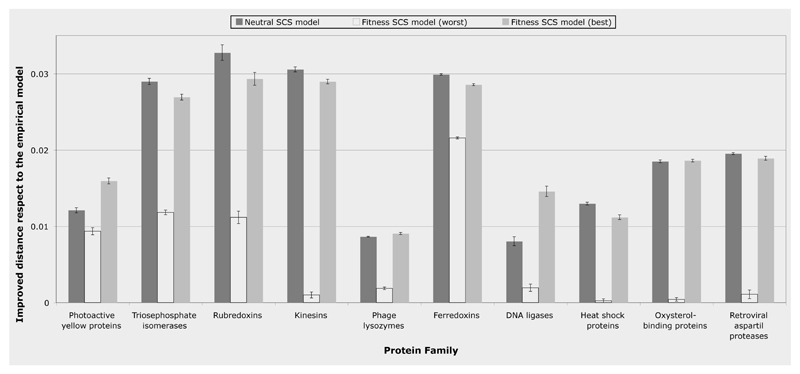
Figure 2.
Improvement of the Kullback-Leibler distance to the real protein alignments of the simulated alignments by the neutral and fitness SCS models with respect to the empirical amino acid substitution model. The “y” axis indicates decline of the distance of the neutral and fitness (best and worst conditions) SCS models respect to the distance of the empirical model. Note that the neutral SCS model was overall more robust than the fitness SCS model under different thermodynamic conditions (see Figures S1A and S1B). On the other hand, the fitness SCS model under the best conditions (see Figures S2A, S2B and S3, left plot) could improve the neutral model in half of protein families, however the worst conditions may lead to results without any improvement respect to the empirical model.

