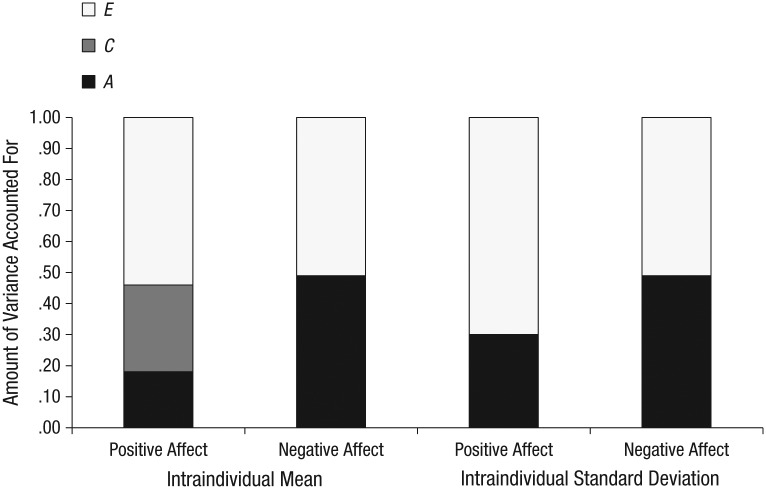
Fig. 1.
Results of the univariate genetic analyses of the intraindividual average of positive and negative affect and the intraindividual variability of positive and negative affect over the course of 1 month. For each measure, the graph shows the amount of variance due to additive-genetic influences (A), shared environmental influences (C), and nonshared environmental influences (E; including measurement error).

