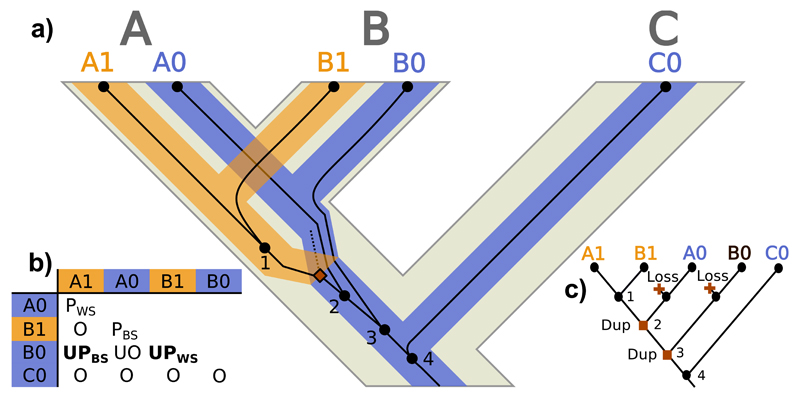
Figure 4.
Unsorted paralog evolution. a) Evolution of a gene tree (thin dark lines) inside a locus tree (medium-thick branches) embedded in a species tree (thick light tree in the background) with ILS at the locus tree level. A, B and C represent species/populations, while A1, A0, B1, B0 and C0 identify gene copies. Black circles represent gene tree nodes (only internal nodes –i.e., coalescences– are numbered), where the dashed line represents an extinct/unsampled lineage. Squares signal duplication events. b) Homology relationships between the gene copies (O: orthologs; UO: unsorted orthologs; PBS: between-species paralogs; PWS: within-species paralogs; UPBS: between-species unsorted paralogs; UPWS: within-species unsorted paralogs). c) Most parsimonious duplication/loss reconciliation of the gene and species trees. Label colors indicate different estimated loci, while text refers to the real loci. Squares signal duplication events and crosses represent losses.

